• Skip to main content
  • Skip to header right navigation
  • Skip to site footer
  • Blog
  • Free Resources
RevistaMed

RevistaMed

  • About
    • Meet Revista
    • Advisory Board
    • Partners
    • Press
    • Rising Leaders Council
    • Sponsorship
    • Contact Us
  • Events
    • 2025 Revista Medical Real Estate Investment Forum
    • Subscriber Webinar
  • Why Subscribe?
    • Revista x Pivotal
    • Featured Products
    • Business Development
    • Underwriting & Due Diligence
    • Asset Management
    • Capital Markets
    • Site Selection & Development
    • Leasing
  • Subscriber Login
Home / Leasing/Property Management / Occupancy in Outpatient Medical Rides High in “Tertiary” Real Estate Markets

Occupancy in Outpatient Medical Rides High in “Tertiary” Real Estate Markets

December 20, 2024 by Mindy Berman Topics: Construction/Development, Leasing/Property Management, Mergers/Acquisitions

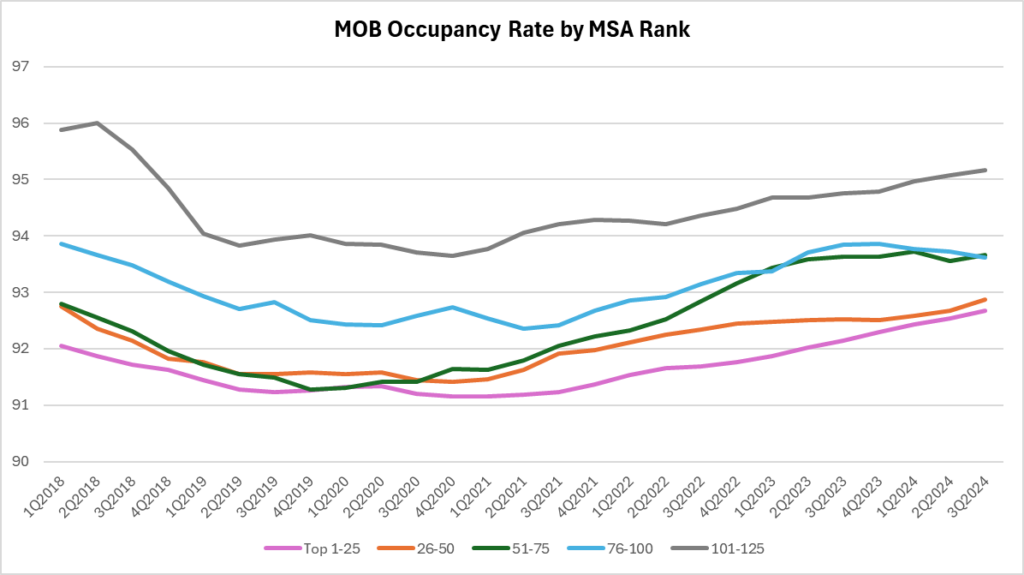
Long-time owners of healthcare properties have recognized this phenomenon for a while – tertiary markets offer high occupancy and high probability of renewal – contrary to conventional investment wisdom in other real property classes.  The average occupancy rate in the Top 100 U.S. metros is at an all-time high of 92.9% in the third quarter of 2024.  However, smaller metros (ranked #101-125) beat this record with occupancy at 95.2%.  Think Fayetteville, Arkansas – #100 on the list – with nearly 600,000 people.  And Salem, Oregon, coming in at #125, with a population of 436,000.  Mighty New York with a metro population of 19.5 million and its Top 25 peers came in at the quintile low occupancy of 92.7%. 

Why?

  • Healthcare is everywhere!  It’s one of the essential services needed by people wherever they live, along with necessities such as groceries, bank, drug store, mobile phone store, etc.
  • Smaller communities are more likely to have purpose built medical, driven by demand from a specific provider.  It is uncommon to have speculative development or overbuilding in small markets, making them more stable investment environments.  From 2019 to today, the number of square feet of MOB completed in the Top 50 metros exceeded absorption by 4.3%.  In the metros ranked 51-125, new supply exceeded absorption by only 1.8%.
  • Medical practices are sticky tenants with high probability of renewal relative to other property classes.  While the stick factor is common throughout the country, small markets have fewer suitable options for relocation.  It is not unusual for a patient to go to the same medical building for care from cradle to grave in a small market.
  • Investment grade health system tenants can be anywhere, and leading specialty or multi-specialty practice groups are as common in small markets as big markets.  With continued consolidation and M&A activity, hospitals in small markets are being gobbled up by major regional players.  Credit quality of the tenant goes up, more clinical support from the acquirer helps to improve access to care and quality for area patients.  As these services grow, it is not uncommon to see development of larger purpose-built Class A MOBs to house an expansion of services.
Mindy Berman
Mindy Berman

Other Articles by Mindy Berman:

    • Health System Transaction Activity: Monetization vs Buybacks
    • 2018 Medical Office Sales Remain at High Level Total – Medical Office Investment Sales
    • JLL Confirms that Scale Promotes Institutional Investment – Top 10 Largest Single MOB Sale Value

Previous Post:Outpatient Real Estate Sector Riding a Wave of Strength!
Next Post:Inpatient Facility Construction Showed Strength in 2024

Sidebar

Topics

  • Construction/Development
  • Industry News
  • Leasing/Property Management
  • Mergers/Acquisitions
  • Policy/Legislation
  • Real Estate Financing/Capital Markets
  • Revista Best Practices
  • Revista News
  • Sponsor Spotlight
  • Transactions
  • Uncategorized

Archives

RSS Recent Blog Posts

  • Limited Transaction Volume to Start 2025 April 29, 2025
    The preliminary 1Q25 numbers are in, and they show that transaction volume has been slow to kick off the year. $1.5 billion worth of MOBs traded in the 1st quarter, and $8.9 billion traded over the past year. This suppressed level of activity is . . . The post Limited Transaction Volume to Start 2025 […]
    Stephen Lindsey
  • A Look at 1Q25’s highest occupied Medical Office Market April 28, 2025
    That’s right!  With a 1Q25 occupancy of 96.9%, Asheville NC is the highest occupied market of the largest 125 metros RevistaMed tracks each quarter.  Asheville, which is still recovering from the effects of Hurricane Helene in September of 2024, can find strength within its healthcare market and within the MOB sector. The post A Look […]
    Mike Hargrave
  • Rising Rents for Newly Built MOBs March 31, 2025
    How have rising construction costs affected rents? Revista’s construction data continues to show increases in the cost of building an MOB. The average cost per square foot came in at $549 for completed MOBs in 2024. That is a . . . The post Rising Rents for Newly Built MOBs appeared first on RevistaMed.
    Stephen Lindsey
  • Cap Rates by Property Price February 28, 2025
    Typically, the transaction stats we look at are only for MOB trades that are at least $2.5 million. However, we do have data on a solid portion of the smaller deals. In the chart below we compare cap rates based on the property price, including those under $2.5M . . . The post Cap Rates […]
    Stephen Lindsey

Other Free Resources

Industry Directory

Search for and/or list your medical real estate services in Revista’s medical real estate directory.

Reports & White Papers

Download free reports & white papers on medical real estate.

Add Lease/Sale Listing

Revista provides free lease/sale listings for healthcare real estate.

Ready to Schedule a Demo?

Get in Touch Now
  • Why Subscribe?
  • Events
  • The MOB Scene
  • Add A Directory Listing
  • Add Lease/Sale Listing
  • Contact Us
  • Sponsorship
  • About
  • Data Terms of Use
  • Sponsorship Terms
  • Press

SIGN UP FOR MOB SCENE NEWSLETTER

  • Twitter
  • Facebook
  • LinkedIn