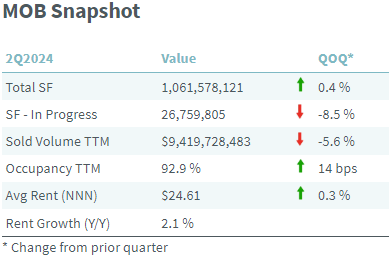
What direction has the MOB market been going in 2024? In this article we are focusing on the Top 100 metro areas. The table below shows a snapshot of the changes observed for key metrics in the second quarter of this year. Inventory continued to grow at a moderate pace, up 0.4% since the first quarter of the year. This is paired with a declining construction pipeline, which fell 8.5% to 26.8 million square feet. The number of new construction projects remains at low levels, but the number of projects delivering is relatively strong. This explains the decreasing size of the SF in progress while still maintaining sizeable inventory growth. Transaction volume stepped down 5.6% with only $9.4 billion in MOB trades over the previous 12 months.
Occupancy has consistently risen since 2021 and this quarter was no different. Up 14 basis points, and now at a level of 92.9%. Rent growth was moderate or strong, depending on which metric you look at. The increase in average triple-net rent was rather moderate with 0.3% quarter-over-quarter, or 1.2% if you annualized that rate. The average same-store, year-over-year rent growth was 2.1%, which is solid growth historically, but lower than what we observed during peak inflation.


