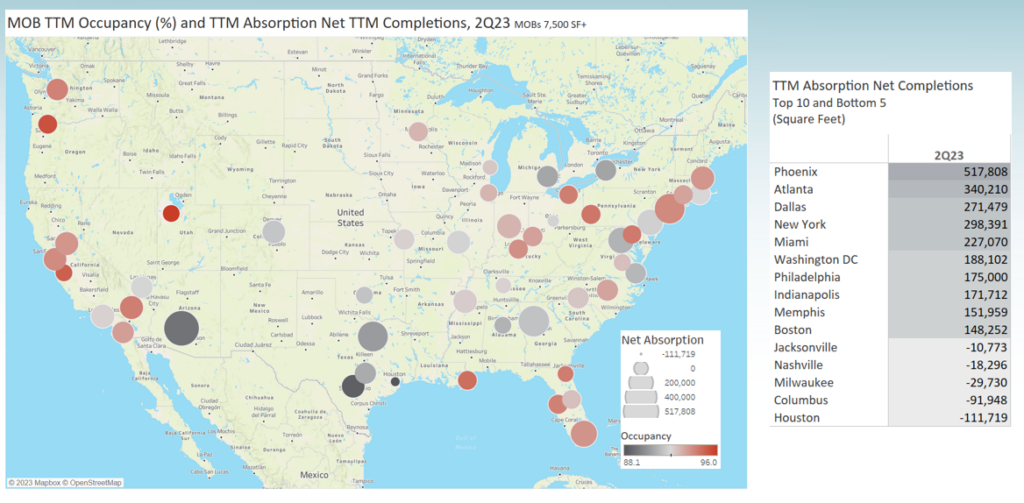
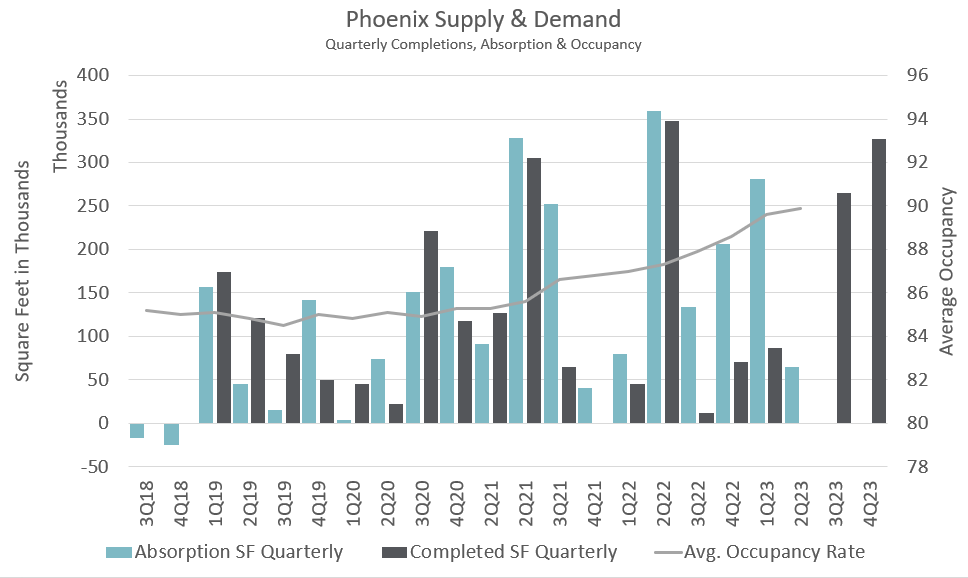
The Northeast and Pacific Coast markets have always had some of the highest occupancy rates for medical office buildings being the more expensive, high barrier-to-entry cities. However, considerable growth in demand is occurring in the sunbelt markets, and Phoenix tops the list. The metro list below and map show net absorption and occupancy for MOBs in the top 50 metro areas. (The larger the circle, the greater demand for space, color of the circle represents occupancy) Absorption reflected here is the annual change in occupied space, minus any construction deliveries during the year. This represents absorption that directly affects a change in occupancy. Phoenix tops the list with 517,808 square feet in net absorption over the past year. That demand has pushed Phoenix occupancy from 87.3% a year ago to 89.9% in the most recent quarter. See the chart below that shows quarterly absorption of space significantly outpacing the new supply coming to market. Phoenix is also one of the top markets for year-over-year, same-store rent growth, sitting at 4.9% in 2Q23. The national rent growth average is 2.8%. Want to find out more about your market? Subscribe to Revista!


