• Skip to main content
  • Skip to header right navigation
  • Skip to site footer
  • Blog
  • Free Resources
RevistaMed

RevistaMed

  • About
    • Meet Revista
    • Advisory Board
    • Partners
    • Press
    • Rising Leaders Council
    • Sponsorship
    • Contact Us
  • Events
    • 2025 Revista Medical Real Estate Investment Forum
    • Subscriber Webinar
  • Why Subscribe?
    • Revista x Pivotal
    • Featured Products
    • Business Development
    • Underwriting & Due Diligence
    • Asset Management
    • Capital Markets
    • Site Selection & Development
    • Leasing
  • Subscriber Login
Home / Industry News / Are MOB Sales Taking Place in the Current Environment?

Are MOB Sales Taking Place in the Current Environment?

October 24, 2023 by Stephen Lindsey Topics: Industry News, Real Estate Financing/Capital Markets, Transactions

The year of 2023 has brought significant drops in sales activity across the commercial real estate sector. The higher cost of capital is driving investors into cautiousness and the healthcare real estate market is not immune. While the underlying fundamentals of medical office buildings (MOBs) are currently quite strong, transaction volume has taken a hit.

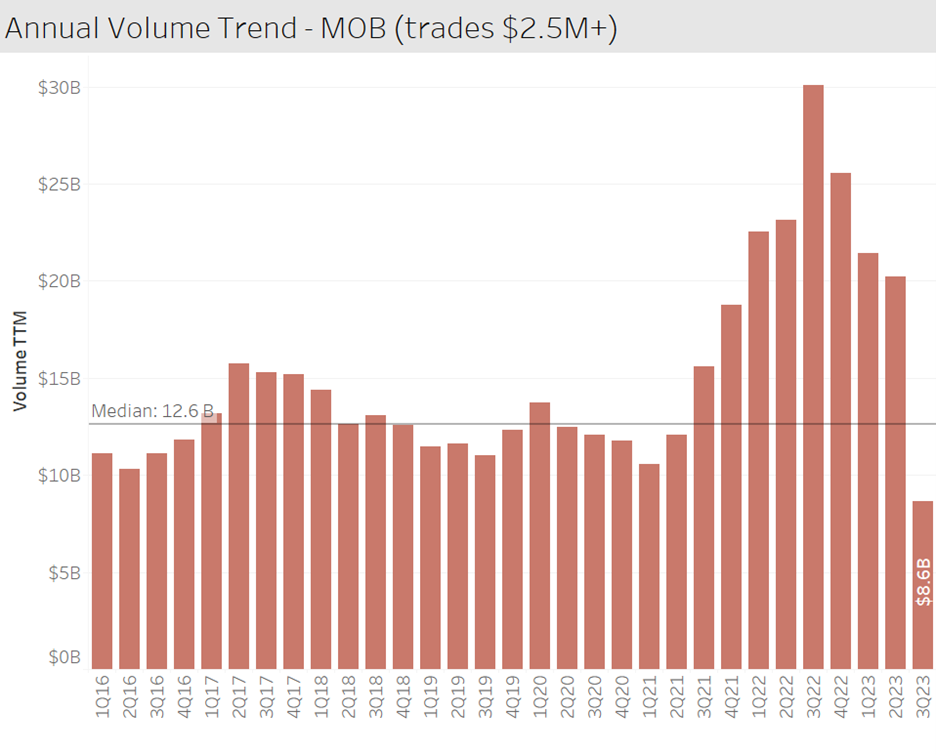
The graph below shows the volume trend on an annual basis. Looking at the number for 3Q23 we can see that there has been $8.6 billion of MOBs traded over the past twelve months. Keep in mind that this is a preliminary number, as over the next month Revista will continue to discover transactions that happened before the end of the quarter. If we compare this number from the peak in 2022, this looks like activity has fallen off a cliff, but it’s important to look at this number from a broader perspective. 2022 was an exceptionally high year for volume and this was exaggerated by the 11-billion-dollar HR-HTA acquisition. If we compare the current number to the median volume over the past 8 years, the drop looks much less drastic, about 32%. There is no doubt that sales are taking a hit, but a fair amount of deals are still going through. We will continue to monitor this statistic, so stay tuned for updates.

Stephen Lindsey

Other Articles by Stephen Lindsey:

    • Limited Transaction Volume to Start 2025
    • Rising Rents for Newly Built MOBs
    • Cap Rates by Property Price

Previous Post:MOBs Located on a Hospital Campus vs. MOBs Close to a Hospital Campus. Is there a Difference?
Next Post:Rent Inflation Impacting Outpatient Sector

Sidebar

Topics

  • Construction/Development
  • Industry News
  • Leasing/Property Management
  • Mergers/Acquisitions
  • Policy/Legislation
  • Real Estate Financing/Capital Markets
  • Revista Best Practices
  • Revista News
  • Sponsor Spotlight
  • Transactions
  • Uncategorized

Archives

RSS Recent Blog Posts

  • Limited Transaction Volume to Start 2025 April 29, 2025
    The preliminary 1Q25 numbers are in, and they show that transaction volume has been slow to kick off the year. $1.5 billion worth of MOBs traded in the 1st quarter, and $8.9 billion traded over the past year. This suppressed level of activity is . . . The post Limited Transaction Volume to Start 2025 […]
    Stephen Lindsey
  • A Look at 1Q25’s highest occupied Medical Office Market April 28, 2025
    That’s right!  With a 1Q25 occupancy of 96.9%, Asheville NC is the highest occupied market of the largest 125 metros RevistaMed tracks each quarter.  Asheville, which is still recovering from the effects of Hurricane Helene in September of 2024, can find strength within its healthcare market and within the MOB sector. The post A Look […]
    Mike Hargrave
  • Rising Rents for Newly Built MOBs March 31, 2025
    How have rising construction costs affected rents? Revista’s construction data continues to show increases in the cost of building an MOB. The average cost per square foot came in at $549 for completed MOBs in 2024. That is a . . . The post Rising Rents for Newly Built MOBs appeared first on RevistaMed.
    Stephen Lindsey
  • Cap Rates by Property Price February 28, 2025
    Typically, the transaction stats we look at are only for MOB trades that are at least $2.5 million. However, we do have data on a solid portion of the smaller deals. In the chart below we compare cap rates based on the property price, including those under $2.5M . . . The post Cap Rates […]
    Stephen Lindsey

Other Free Resources

Industry Directory

Search for and/or list your medical real estate services in Revista’s medical real estate directory.

Reports & White Papers

Download free reports & white papers on medical real estate.

Add Lease/Sale Listing

Revista provides free lease/sale listings for healthcare real estate.

Ready to Schedule a Demo?

Get in Touch Now
  • Why Subscribe?
  • Events
  • The MOB Scene
  • Add A Directory Listing
  • Add Lease/Sale Listing
  • Contact Us
  • Sponsorship
  • About
  • Data Terms of Use
  • Sponsorship Terms
  • Press

SIGN UP FOR MOB SCENE NEWSLETTER

  • Twitter
  • Facebook
  • LinkedIn