• Skip to main content
  • Skip to header right navigation
  • Skip to site footer
  • Blog
  • Free Resources
RevistaMed

RevistaMed

  • About
    • Meet Revista
    • Advisory Board
    • Partners
    • Press
    • Rising Leaders Council
    • Sponsorship
    • Contact Us
  • Events
    • 2026 Revista Medical Real Estate Investment Forum
    • Subscriber Webinar
  • Why Subscribe?
    • Schedule a Demo
    • Revista x Pivotal
    • Featured Products
    • Business Development
    • Underwriting & Due Diligence
    • Asset Management
    • Capital Markets
    • Site Selection & Development
    • Leasing
  • Subscriber Login
Home / Uncategorized / Demand for Outpatient Space Growing Faster than Supply

Demand for Outpatient Space Growing Faster than Supply

November 28, 2023 by Mike Hargrave Topics: Uncategorized

It is no secret that many healthcare services and procedures are increasingly moving towards an outpatient setting.  Advances in technology, cost efficiencies and other factors have enabled this move which has led to consistent and steady growth of demand for outpatient space, and the underlying supply of such space.  Revista normally tracks the supply/demand picture through its reporting of absorption, completions and occupancy rates.

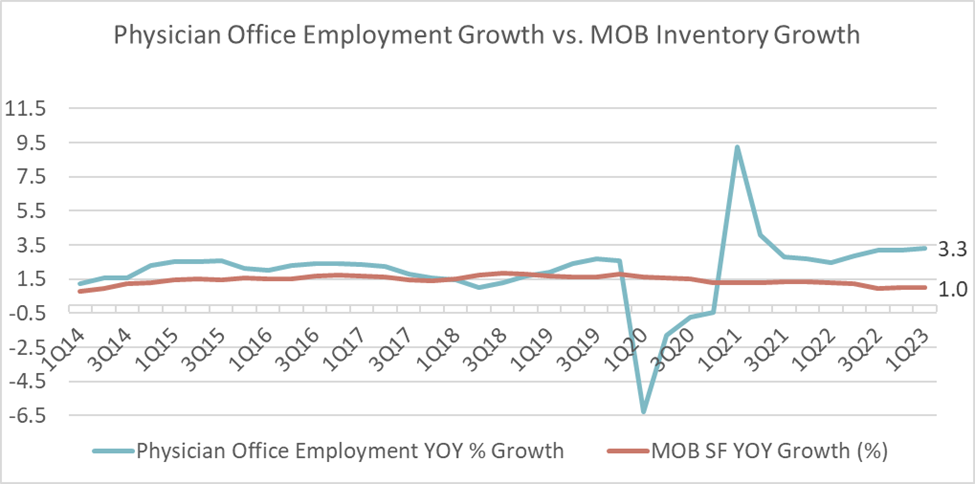
Another way to track the supply/demand picture of the outpatient sector is through growth in physician office employment compared to supply or inventory growth.  The below graph displays physician office employment growth (data sourced from the U.S. Bureau of Labor Statistics) and compares it to outpatient or MOB inventory growth (data sourced from Revistamed.com). 

Up until the Pandemic in 2020 physician office employment was growing at levels just above underlying inventory growth.  Both measures grew under 3% annually during that time.  The occupancy rates for the outpatient sector were fairly steady during this period of balanced supply and demand.

But a different picture has emerged since the pandemic.  Namely, physician office employment is growing faster than underlying supply of space.  As of the 3rd quarter of 2023, physician office employment grew 3.3% annually while the outpatient or MOB inventory grew by just 1%.  Interestingly, during this period we have seen occupancy rates for the outpatient sector growing consistently as absorption of space has been outpacing completions.

Stay tuned to www.revistamed.com as we continue to track these trends.

Physician Office Employment Data Source; U.S. Bureau of Labor Statistics, All Employees, Offices of Physicians [CES6562110001], retrieved from FRED, Federal Reserve Bank of St. Louis; https://fred.stlouisfed.org/series/CES6562110001, September 29, 2023.

Source and Copyright: Revista. Data believed to be accurate but not guaranteed and is subject to future revision. Use of this data is permitted subject to terms and conditions detailed on data.revistamed.com/terms-of-use and with proper credit to Revista or Revistamed.com.

Mike Hargrave
Mike Hargrave

Other Articles by Mike Hargrave:

    • The Return of the Portfolio Premium
    • A Look at 1Q25’s highest occupied Medical Office Market
    • Outpatient Real Estate Sector Riding a Wave of Strength!

Previous Post:Rent Inflation Impacting Outpatient Sector
Next Post:MOB Fundamentals Remain Steady

Sidebar

Topics

  • Construction/Development
  • Industry News
  • Leasing/Property Management
  • Mergers/Acquisitions
  • Policy/Legislation
  • Real Estate Financing/Capital Markets
  • Revista Best Practices
  • Revista News
  • Sponsor Spotlight
  • Transactions
  • Uncategorized

Archives

RSS Recent Blog Posts

  • MOB Construction Update May 29, 2025
    MOB construction has been slower than usual in 2025. Less projects are breaking ground than are completing, so the pipeline has been shrinking. In recent times, inventory has typically grown around 1.5% annually. Over the past year MOB inventory has grown . . . The post MOB Construction Update appeared first on RevistaMed.
    Stephen Lindsey
  • The Return of the Portfolio Premium May 27, 2025
    The graph below displays Average MOB cap rate trends for Portfolios vs. Single Properties.  From 2017 through 2022, the Average Cap Rate for MOB Portfolios was 63 basis points lower than single MOB properties that traded. The post The Return of the Portfolio Premium appeared first on RevistaMed.
    Mike Hargrave
  • Limited Transaction Volume to Start 2025 April 29, 2025
    The preliminary 1Q25 numbers are in, and they show that transaction volume has been slow to kick off the year. $1.5 billion worth of MOBs traded in the 1st quarter, and $8.9 billion traded over the past year. This suppressed level of activity is . . . The post Limited Transaction Volume to Start 2025 […]
    Stephen Lindsey
  • A Look at 1Q25’s highest occupied Medical Office Market April 28, 2025
    That’s right!  With a 1Q25 occupancy of 96.9%, Asheville NC is the highest occupied market of the largest 125 metros RevistaMed tracks each quarter.  Asheville, which is still recovering from the effects of Hurricane Helene in September of 2024, can find strength within its healthcare market and within the MOB sector. The post A Look […]
    Mike Hargrave

Other Free Resources

Industry Directory

Search for and/or list your medical real estate services in Revista’s medical real estate directory.

Reports & White Papers

Download free reports & white papers on medical real estate.

Add Lease/Sale Listing

Revista provides free lease/sale listings for healthcare real estate.

Ready to Schedule a Demo?

Get in Touch Now
  • Why Subscribe?
  • Events
  • The MOB Scene
  • Add A Directory Listing
  • Add Lease/Sale Listing
  • Contact Us
  • Sponsorship
  • About
  • Data Terms of Use
  • Sponsorship Terms
  • Press

SIGN UP FOR MOB SCENE NEWSLETTER

  • Twitter
  • Facebook
  • LinkedIn