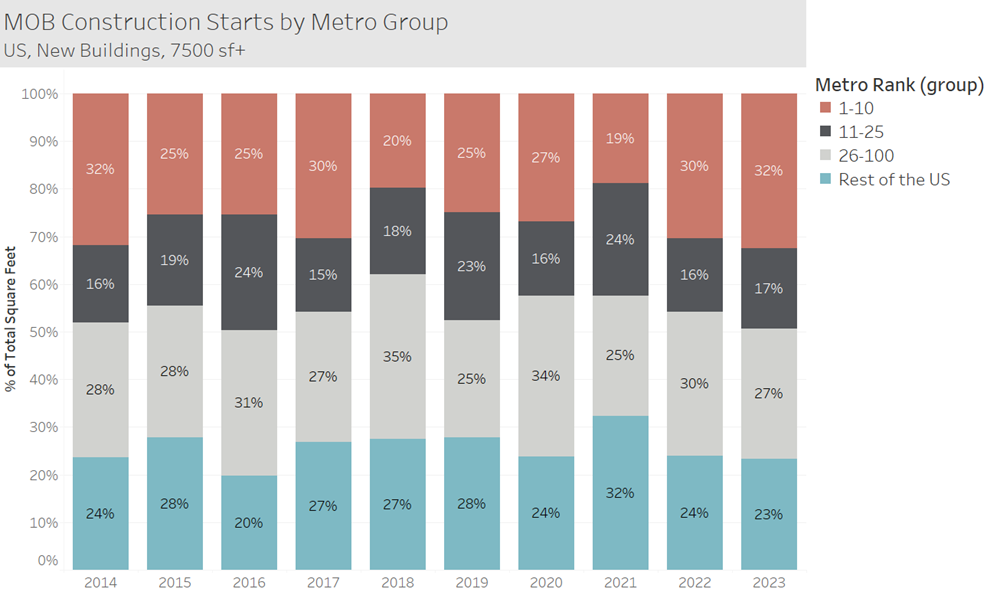
2023 was a slow year for medical office developments, with around 12 million square feet of projects that broke ground. This is about 45% lower than the average over the past decade. However, 12 million square feet is still a substantial increase in supply, and it is interesting to observe how different markets are reacting. In the graph below, we have grouped each market into 4 categories based on their size ranking. So the 1-10 red bar represents the percentage of that years construction that took place in the 10 largest metro areas. When focusing on 2023, one thing to note is that the 1-10 group took a slightly higher share than usual. Coming in at 32%, this is higher than its average of 27%. All three of the other categories were 1% to 2% lower than their average. This indicates that the larger core markets have been slightly favored for developments within the slow year of 2023.
This is just a bird’s eye view. If you’re interested in all the details of each market, contact us about a subscription.


