• Skip to main content
  • Skip to header right navigation
  • Skip to site footer
  • Blog
  • Free Resources
RevistaMed

RevistaMed

  • About
    • Meet Revista
    • Advisory Board
    • Partners
    • Press
    • Rising Leaders Council
    • Sponsorship
    • Contact Us
  • Events
    • 2025 Revista Medical Real Estate Investment Forum
    • Subscriber Webinar
  • Why Subscribe?
    • Revista x Pivotal
    • Featured Products
    • Business Development
    • Underwriting & Due Diligence
    • Asset Management
    • Capital Markets
    • Site Selection & Development
    • Leasing
  • Subscriber Login
Home / Transactions / Health System Transaction Activity: Monetization vs Buybacks

Health System Transaction Activity: Monetization vs Buybacks

November 20, 2024 by Mindy Berman Topics: Mergers/Acquisitions, Real Estate Financing/Capital Markets, Transactions

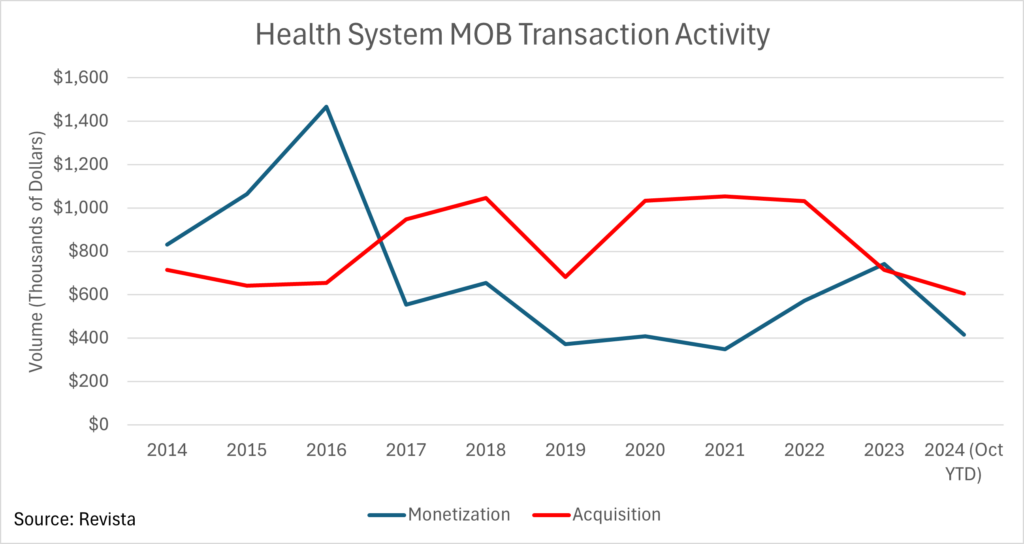
Health systems have been buying back outpatient medical buildings from third party investors at a faster clip in the last two years than in the past.  This phenomenon is somewhat counterintuitive given the increase in interest rates since 2022 and lower operating margins in healthcare.

Health system activity from buybacks and dispositions of MOBs is a relatively small contributor to MOB transaction volume.  Over the last 10 years, health systems have been involved in one side or the other of approximately 12% of sales.  In the last two years, when transactions activity has been muted overall, health system activity made up 17-18% of market sales.  Buybacks were greater than monetization on average – 7.4% compared to 6.0%. 

At a time when interest rates have risen dramatically and hospitals are under continued margin pressure, why is this phenomenon occurring?  With outpatient medical services generating more than 50% of net patient revenue at health systems, strategic ownership of facilities by the providers is a natural extension.

  • The natural and historical proclivity by health systems to own real estate, dating back to the time when outpatient medical was centered at hospital campuses.
  • Cash and investments levels have bounced back at health systems, with improving operating margins from the depths of the pandemic and the stock market rally which have fortified many health system balance sheets.
  • Cap rates for MOBs have gone up to 10-year highs given the rise in general interest rates, allowing buybacks by health systems in the 6% range versus 5% at peak market, offering a discount of roughly 15-20% on the purchase price today.
  • The historical relationship between tax-exempt and taxable bond rates has returned, offering the hospital borrowers the advantage of lower tax-exempt rates, if applicable for the first time since the Great Financial Crisis.  Tax-exempt bonds in the 4% range offer a compelling benefit over taxable bonds at 6% or the higher cost of third party capital.  Bond issuance has accelerated as improving health system fortunes and muni investor appetite has grown.
  • Property tax savings from ownership are real and compelling, especially in high tax locations.  It is not unusual for a third party MOB landlord to pass through property tax expense under triple net leases equal to $1 or $3 million.  Eliminating rent escalations and upward market rent resets are another benefit for occupancy cost.

Buybacks may be prompted by a right of first refusal (ROFR) on a property sale.  But they are just as likely to occur on a non-contractual basis.  Owners seeking liquidity and/or faced with a refinancing event, especially with a short WALT property, have allowed health systems to negotiate favorable arrangements for themselves.  A health system buyer is considered a motivated and reliable buyer, especially in a liquidity-limited lending environment.  Health systems paying all cash offer certainty of execution given their deep balance sheet and nexus to the properties.  Alternative financing structures such as credit tenant leases (CTL), synthetic leases, and not-for-profit lessors exist, making it possible to achieve other balance sheet, financial metric and P&L goals of a health system.

For additional information, contact Mindy Berman at mindy.berman66@icloud.com

Mindy Berman
Mindy Berman

Other Articles by Mindy Berman:

    • Occupancy in Outpatient Medical Rides High in “Tertiary” Real Estate Markets
    • 2018 Medical Office Sales Remain at High Level Total – Medical Office Investment Sales
    • JLL Confirms that Scale Promotes Institutional Investment – Top 10 Largest Single MOB Sale Value

Previous Post:Off Campus MOBs Catching up to On Campus MOBs in the Top 50 Metros
Next Post:Outpatient Real Estate Sector Riding a Wave of Strength!

Sidebar

Topics

  • Construction/Development
  • Industry News
  • Leasing/Property Management
  • Mergers/Acquisitions
  • Policy/Legislation
  • Real Estate Financing/Capital Markets
  • Revista Best Practices
  • Revista News
  • Sponsor Spotlight
  • Transactions
  • Uncategorized

Archives

RSS Recent Blog Posts

  • Limited Transaction Volume to Start 2025 April 29, 2025
    The preliminary 1Q25 numbers are in, and they show that transaction volume has been slow to kick off the year. $1.5 billion worth of MOBs traded in the 1st quarter, and $8.9 billion traded over the past year. This suppressed level of activity is . . . The post Limited Transaction Volume to Start 2025 […]
    Stephen Lindsey
  • A Look at 1Q25’s highest occupied Medical Office Market April 28, 2025
    That’s right!  With a 1Q25 occupancy of 96.9%, Asheville NC is the highest occupied market of the largest 125 metros RevistaMed tracks each quarter.  Asheville, which is still recovering from the effects of Hurricane Helene in September of 2024, can find strength within its healthcare market and within the MOB sector. The post A Look […]
    Mike Hargrave
  • Rising Rents for Newly Built MOBs March 31, 2025
    How have rising construction costs affected rents? Revista’s construction data continues to show increases in the cost of building an MOB. The average cost per square foot came in at $549 for completed MOBs in 2024. That is a . . . The post Rising Rents for Newly Built MOBs appeared first on RevistaMed.
    Stephen Lindsey
  • Cap Rates by Property Price February 28, 2025
    Typically, the transaction stats we look at are only for MOB trades that are at least $2.5 million. However, we do have data on a solid portion of the smaller deals. In the chart below we compare cap rates based on the property price, including those under $2.5M . . . The post Cap Rates […]
    Stephen Lindsey

Other Free Resources

Industry Directory

Search for and/or list your medical real estate services in Revista’s medical real estate directory.

Reports & White Papers

Download free reports & white papers on medical real estate.

Add Lease/Sale Listing

Revista provides free lease/sale listings for healthcare real estate.

Ready to Schedule a Demo?

Get in Touch Now
  • Why Subscribe?
  • Events
  • The MOB Scene
  • Add A Directory Listing
  • Add Lease/Sale Listing
  • Contact Us
  • Sponsorship
  • About
  • Data Terms of Use
  • Sponsorship Terms
  • Press

SIGN UP FOR MOB SCENE NEWSLETTER

  • Twitter
  • Facebook
  • LinkedIn