• Skip to main content
  • Skip to header right navigation
  • Skip to site footer
  • Blog
  • Free Resources
RevistaMed

RevistaMed

  • About
    • Meet Revista
    • Advisory Board
    • Partners
    • Press
    • Rising Leaders Council
    • Sponsorship
    • Contact Us
  • Events
    • 2026 Revista Medical Real Estate Investment Forum
    • Subscriber Webinar
  • Why Subscribe?
    • Schedule a Demo
    • Revista x Pivotal
    • Featured Products
    • Business Development
    • Underwriting & Due Diligence
    • Asset Management
    • Capital Markets
    • Site Selection & Development
    • Leasing
  • Subscriber Login
Home / Uncategorized / MOB Fundamentals Have Remained Strong in 3Q22

MOB Fundamentals Have Remained Strong in 3Q22

October 31, 2022 by Stephen Lindsey Topics: Uncategorized

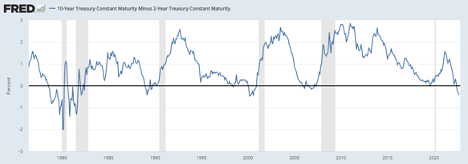
An inversion of the yield curve is a well-known indicator of a coming economic downturn. Using the difference between the 10-year and 2-year treasury spread, we can see that the difference became negative this July and has remained negative so far. Recessions, which are represented by the gray bars, are often preceded by a period with a negative spread. A negative spread means that the 10-year interest rate is lower than the 2-year. Most of the time, long term interest rates are above their short-term counterparts. This is due to the higher uncertainty that is faced the farther you go into the future. However, when the short-term rates are higher, it is indicating that market participants are pessimistic about how the economy will perform in the near future.

Federal Reserve Bank of St. Louis, 10-Year Treasury Constant Maturity Minus 2-Year Treasury Constant Maturity [T10Y2Y], retrieved from FRED, Federal Reserve Bank of St. Louis; https://fred.stlouisfed.org/series/T10Y2Y, October 30, 2022.

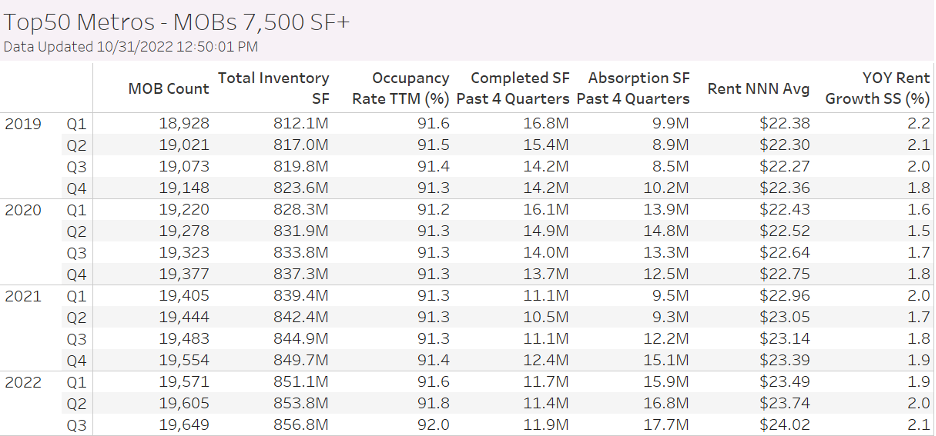
A negative 10-2 spread is a leading indicator of economic downturn, so a recession often takes some time to form. With all the gloom in the market, how is the MOB sector doing? At the close of 3Q22, we are still seeing strong overall fundamentals. Looking at the top 50 metros, our data is showing increased occupancy and rents. While construction completions are not what they were pre-pandemic, demand for space has continued to be strong with absorption of 17.7 million square feet in the past year.

For a more in depth look at the market, make sure to check out the recording of our 3Q22 webcast from last week. 

Stephen Lindsey

Other Articles by Stephen Lindsey:

    • MOB Construction Update
    • Limited Transaction Volume to Start 2025
    • Rising Rents for Newly Built MOBs

Previous Post:Lenders to the Medical Office Sector Signaling Caution, Lower Volumes
Next Post:Physicians Moving Away from Independent Practice, Monetizing their Real Estate

Sidebar

Topics

  • Construction/Development
  • Industry News
  • Leasing/Property Management
  • Mergers/Acquisitions
  • Policy/Legislation
  • Real Estate Financing/Capital Markets
  • Revista Best Practices
  • Revista News
  • Sponsor Spotlight
  • Transactions
  • Uncategorized

Archives

RSS Recent Blog Posts

  • MOB Construction Update May 29, 2025
    MOB construction has been slower than usual in 2025. Less projects are breaking ground than are completing, so the pipeline has been shrinking. In recent times, inventory has typically grown around 1.5% annually. Over the past year MOB inventory has grown . . . The post MOB Construction Update appeared first on RevistaMed.
    Stephen Lindsey
  • The Return of the Portfolio Premium May 27, 2025
    The graph below displays Average MOB cap rate trends for Portfolios vs. Single Properties.  From 2017 through 2022, the Average Cap Rate for MOB Portfolios was 63 basis points lower than single MOB properties that traded. The post The Return of the Portfolio Premium appeared first on RevistaMed.
    Mike Hargrave
  • Limited Transaction Volume to Start 2025 April 29, 2025
    The preliminary 1Q25 numbers are in, and they show that transaction volume has been slow to kick off the year. $1.5 billion worth of MOBs traded in the 1st quarter, and $8.9 billion traded over the past year. This suppressed level of activity is . . . The post Limited Transaction Volume to Start 2025 […]
    Stephen Lindsey
  • A Look at 1Q25’s highest occupied Medical Office Market April 28, 2025
    That’s right!  With a 1Q25 occupancy of 96.9%, Asheville NC is the highest occupied market of the largest 125 metros RevistaMed tracks each quarter.  Asheville, which is still recovering from the effects of Hurricane Helene in September of 2024, can find strength within its healthcare market and within the MOB sector. The post A Look […]
    Mike Hargrave

Other Free Resources

Industry Directory

Search for and/or list your medical real estate services in Revista’s medical real estate directory.

Reports & White Papers

Download free reports & white papers on medical real estate.

Add Lease/Sale Listing

Revista provides free lease/sale listings for healthcare real estate.

Ready to Schedule a Demo?

Get in Touch Now
  • Why Subscribe?
  • Events
  • The MOB Scene
  • Add A Directory Listing
  • Add Lease/Sale Listing
  • Contact Us
  • Sponsorship
  • About
  • Data Terms of Use
  • Sponsorship Terms
  • Press

SIGN UP FOR MOB SCENE NEWSLETTER

  • Twitter
  • Facebook
  • LinkedIn