• Skip to main content
  • Skip to header right navigation
  • Skip to site footer
  • Blog
  • Free Resources
RevistaMed

RevistaMed

  • About
    • Meet Revista
    • Advisory Board
    • Partners
    • Press
    • Rising Leaders Council
    • Sponsorship
    • Contact Us
  • Events
    • 2025 Revista Medical Real Estate Investment Forum
    • Subscriber Webinar
  • Why Subscribe?
    • Revista x Pivotal
    • Featured Products
    • Business Development
    • Underwriting & Due Diligence
    • Asset Management
    • Capital Markets
    • Site Selection & Development
    • Leasing
  • Subscriber Login
Home / Revista Best Practices / MOB Rents: Does being close to a hospital matter?

MOB Rents: Does being close to a hospital matter?

August 6, 2021 by Stephen Lindsey Topics: Revista Best Practices

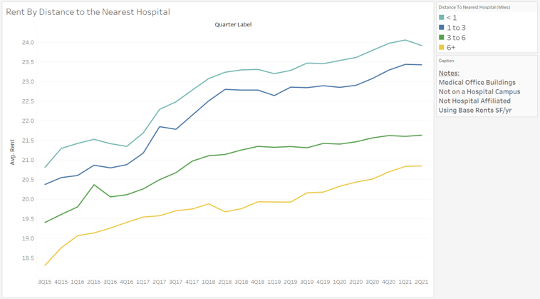
Are MOB rents significantly higher when in close proximity to a hospital? To isolate the effect a property’s distance from the nearest hospital has on rent, we looked at a dataset of MOB’s that are not affiliated with a hospital, nor directly on a hospital campus. It is plausible that on campus and hospital affiliated properties have a rent premium, which could inflate the average rents of MOB’s that are close by to hospitals.

Below is a graph that shows the rent trends for the last 6 years. The different lines are based on a property’s distance to the closest hospital in miles. Each line maintains a gap of around $0.5-$1.5 with their adjacent, and the lowest and highest lines maintain a gap of around $2-$4. The order of the lines follows the conventional idea that there is a correlation between being close to a hospital and higher rents. 

One possible contributor to the difference between the groups is population density. We know that rent is more expensive in urban areas and part of the variation in this graph could be reflecting the higher rents that are charged in cities. Due to the large quantity of buildings, cities are going to have a lot more MOB’s that happen to be close to a hospital. To take a deeper look at this, the following graph is the same as the previous, except it only includes properties that have a population of less than 150,000 within a five-mile radius. These properties make up roughly the bottom third of the previous dataset, in terms of population density. 

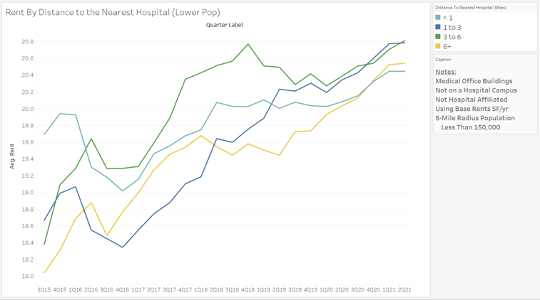
The resulting graph is different in several ways. The first being that there are a lot of crossovers between the lines, indicating that the previous correlation is not present within these less dense areas. The second is that there is a convergence that has been happening in the last year and a half. The properties closest to hospitals saw the least overall growth across the six-year period ($0.75), and the properties farthest away saw the largest ($2.50). This could be due to random variation, but it could also be indicating the increased demand for outpatient facilities that reach closer to communities. Make sure to stay tuned as we continue to observe these trends.

Stephen Lindsey

Other Articles by Stephen Lindsey:

    • Limited Transaction Volume to Start 2025
    • Rising Rents for Newly Built MOBs
    • Cap Rates by Property Price

Previous Post:11 Leadership Lessons Learned from a Conversation with Terry Wood
Next Post:MOBs continue to perform well, with occupancy in top 50 markets rising to 91.7%

Sidebar

Topics

  • Construction/Development
  • Industry News
  • Leasing/Property Management
  • Mergers/Acquisitions
  • Policy/Legislation
  • Real Estate Financing/Capital Markets
  • Revista Best Practices
  • Revista News
  • Sponsor Spotlight
  • Transactions
  • Uncategorized

Archives

RSS Recent Blog Posts

  • Limited Transaction Volume to Start 2025 April 29, 2025
    The preliminary 1Q25 numbers are in, and they show that transaction volume has been slow to kick off the year. $1.5 billion worth of MOBs traded in the 1st quarter, and $8.9 billion traded over the past year. This suppressed level of activity is . . . The post Limited Transaction Volume to Start 2025 […]
    Stephen Lindsey
  • A Look at 1Q25’s highest occupied Medical Office Market April 28, 2025
    That’s right!  With a 1Q25 occupancy of 96.9%, Asheville NC is the highest occupied market of the largest 125 metros RevistaMed tracks each quarter.  Asheville, which is still recovering from the effects of Hurricane Helene in September of 2024, can find strength within its healthcare market and within the MOB sector. The post A Look […]
    Mike Hargrave
  • Rising Rents for Newly Built MOBs March 31, 2025
    How have rising construction costs affected rents? Revista’s construction data continues to show increases in the cost of building an MOB. The average cost per square foot came in at $549 for completed MOBs in 2024. That is a . . . The post Rising Rents for Newly Built MOBs appeared first on RevistaMed.
    Stephen Lindsey
  • Cap Rates by Property Price February 28, 2025
    Typically, the transaction stats we look at are only for MOB trades that are at least $2.5 million. However, we do have data on a solid portion of the smaller deals. In the chart below we compare cap rates based on the property price, including those under $2.5M . . . The post Cap Rates […]
    Stephen Lindsey

Other Free Resources

Industry Directory

Search for and/or list your medical real estate services in Revista’s medical real estate directory.

Reports & White Papers

Download free reports & white papers on medical real estate.

Add Lease/Sale Listing

Revista provides free lease/sale listings for healthcare real estate.

Ready to Schedule a Demo?

Get in Touch Now
  • Why Subscribe?
  • Events
  • The MOB Scene
  • Add A Directory Listing
  • Add Lease/Sale Listing
  • Contact Us
  • Sponsorship
  • About
  • Data Terms of Use
  • Sponsorship Terms
  • Press

SIGN UP FOR MOB SCENE NEWSLETTER

  • Twitter
  • Facebook
  • LinkedIn