• Skip to main content
  • Skip to header right navigation
  • Skip to site footer
  • Blog
  • Free Resources
RevistaMed

RevistaMed

  • About
    • Meet Revista
    • Advisory Board
    • Partners
    • Press
    • Rising Leaders Council
    • Sponsorship
    • Contact Us
  • Events
    • 2025 Revista Medical Real Estate Investment Forum
    • Subscriber Webinar
  • Why Subscribe?
    • Revista x Pivotal
    • Featured Products
    • Business Development
    • Underwriting & Due Diligence
    • Asset Management
    • Capital Markets
    • Site Selection & Development
    • Leasing
  • Subscriber Login
Home / Transactions / MOB Transaction Prices

MOB Transaction Prices

September 29, 2022 by Stephen Lindsey Topics: Mergers/Acquisitions, Real Estate Financing/Capital Markets, Transactions

If you have been following our MOB transaction trends lately, you know that volume has been very high over the past year. In the second quarter of this year, Revista recorded new highs in annual transaction volume. To take a deeper dive into the transaction activity, we looked at the pricing distributions for this past year and compared it to 2019. 

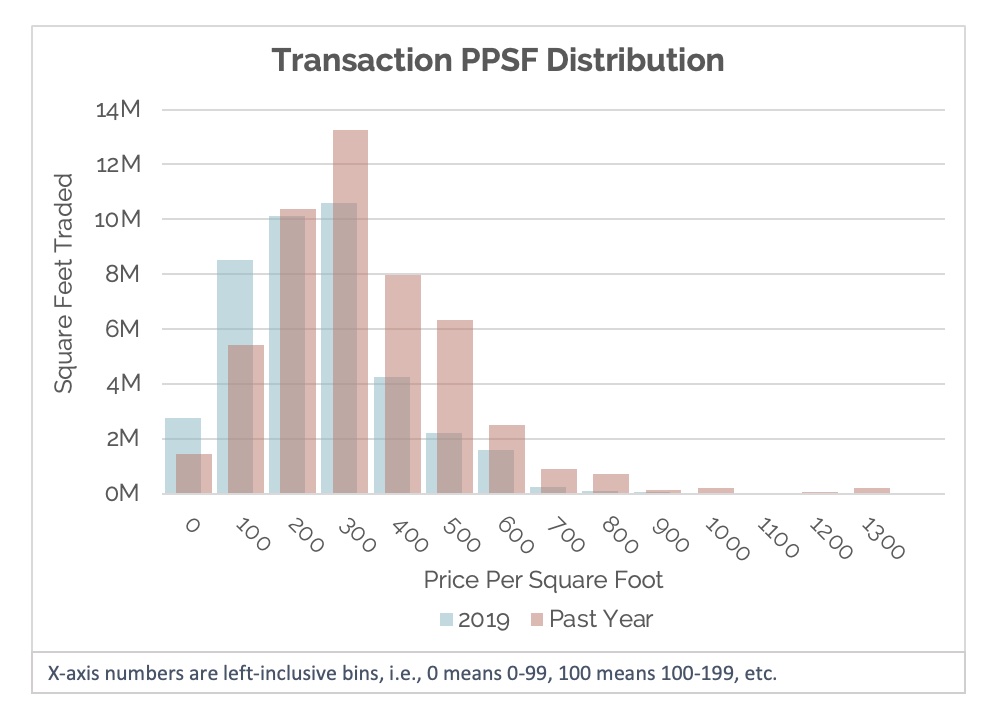
We can see that the recent increase in volume has come from properties trading at mid to high prices. During this past year, transactions in the range of $300-599 ppsf have around 10 million more square feet.  On the contrary, transactions in the range of $0-199 ppsf have around 4 million less. 

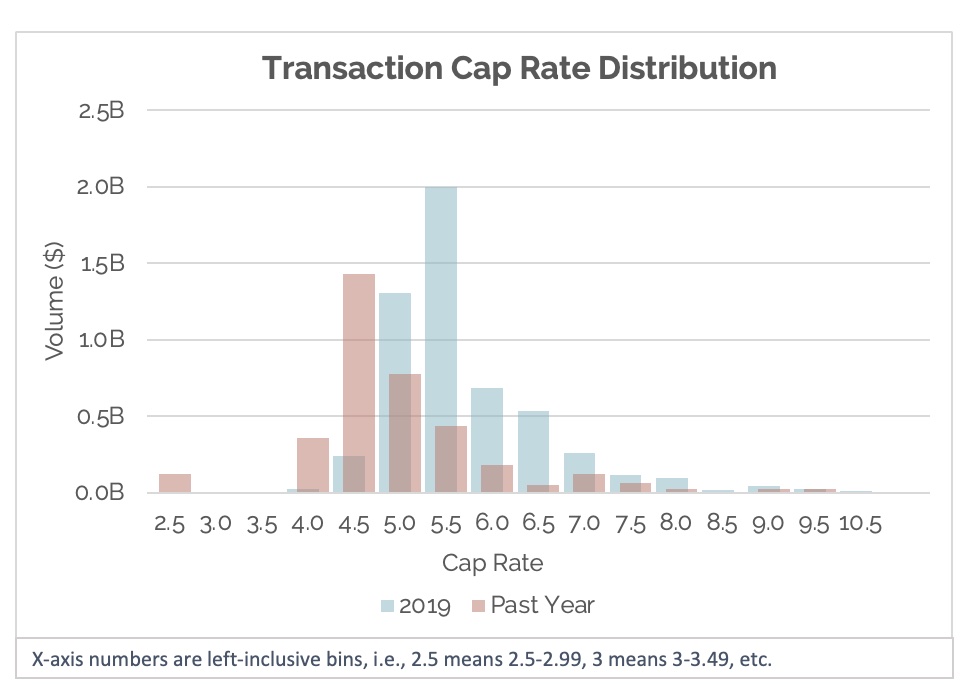
We can see similar patterns when looking at cap rates. The shapes of the distributions are alike, but this past year is shifted to the left, indicating a premium on recent transactions. There are a few possible contributors to the higher pricing we have been seeing. One is the influx of capital into the sector. More capital increases investor competition and therefore the prices of assets being sold. Another is the possibility that owners have been more willing to sell off some of their premium assets. The exact cause of this trend and whether it will continue as the FED continues to hike interest rates is unclear. Make sure to stay tuned, as we will keep you up to date on how things play out. 

Stephen Lindsey

Other Articles by Stephen Lindsey:

    • Limited Transaction Volume to Start 2025
    • Rising Rents for Newly Built MOBs
    • Cap Rates by Property Price

Previous Post:3Q MOB Construction Pipeline Hits 51 million SF as Opens Remain Low
Next Post:Curious about PACE Financing?

Sidebar

Topics

  • Construction/Development
  • Industry News
  • Leasing/Property Management
  • Mergers/Acquisitions
  • Policy/Legislation
  • Real Estate Financing/Capital Markets
  • Revista Best Practices
  • Revista News
  • Sponsor Spotlight
  • Transactions
  • Uncategorized

Archives

RSS Recent Blog Posts

  • Limited Transaction Volume to Start 2025 April 29, 2025
    The preliminary 1Q25 numbers are in, and they show that transaction volume has been slow to kick off the year. $1.5 billion worth of MOBs traded in the 1st quarter, and $8.9 billion traded over the past year. This suppressed level of activity is . . . The post Limited Transaction Volume to Start 2025 […]
    Stephen Lindsey
  • A Look at 1Q25’s highest occupied Medical Office Market April 28, 2025
    That’s right!  With a 1Q25 occupancy of 96.9%, Asheville NC is the highest occupied market of the largest 125 metros RevistaMed tracks each quarter.  Asheville, which is still recovering from the effects of Hurricane Helene in September of 2024, can find strength within its healthcare market and within the MOB sector. The post A Look […]
    Mike Hargrave
  • Rising Rents for Newly Built MOBs March 31, 2025
    How have rising construction costs affected rents? Revista’s construction data continues to show increases in the cost of building an MOB. The average cost per square foot came in at $549 for completed MOBs in 2024. That is a . . . The post Rising Rents for Newly Built MOBs appeared first on RevistaMed.
    Stephen Lindsey
  • Cap Rates by Property Price February 28, 2025
    Typically, the transaction stats we look at are only for MOB trades that are at least $2.5 million. However, we do have data on a solid portion of the smaller deals. In the chart below we compare cap rates based on the property price, including those under $2.5M . . . The post Cap Rates […]
    Stephen Lindsey

Other Free Resources

Industry Directory

Search for and/or list your medical real estate services in Revista’s medical real estate directory.

Reports & White Papers

Download free reports & white papers on medical real estate.

Add Lease/Sale Listing

Revista provides free lease/sale listings for healthcare real estate.

Ready to Schedule a Demo?

Get in Touch Now
  • Why Subscribe?
  • Events
  • The MOB Scene
  • Add A Directory Listing
  • Add Lease/Sale Listing
  • Contact Us
  • Sponsorship
  • About
  • Data Terms of Use
  • Sponsorship Terms
  • Press

SIGN UP FOR MOB SCENE NEWSLETTER

  • Twitter
  • Facebook
  • LinkedIn