• Skip to main content
  • Skip to header right navigation
  • Skip to site footer
  • Blog
  • Free Resources
RevistaMed

RevistaMed

  • About
    • Meet Revista
    • Advisory Board
    • Partners
    • Press
    • Rising Leaders Council
    • Sponsorship
    • Contact Us
  • Events
    • 2025 Revista Medical Real Estate Investment Forum
    • Subscriber Webinar
  • Why Subscribe?
    • Revista x Pivotal
    • Featured Products
    • Business Development
    • Underwriting & Due Diligence
    • Asset Management
    • Capital Markets
    • Site Selection & Development
    • Leasing
  • Subscriber Login
Home / Leasing/Property Management / Physician Services PPI Not Following Inflation….yet

Physician Services PPI Not Following Inflation….yet

June 23, 2022 by Hilda Martin Topics: Leasing/Property Management, Real Estate Financing/Capital Markets

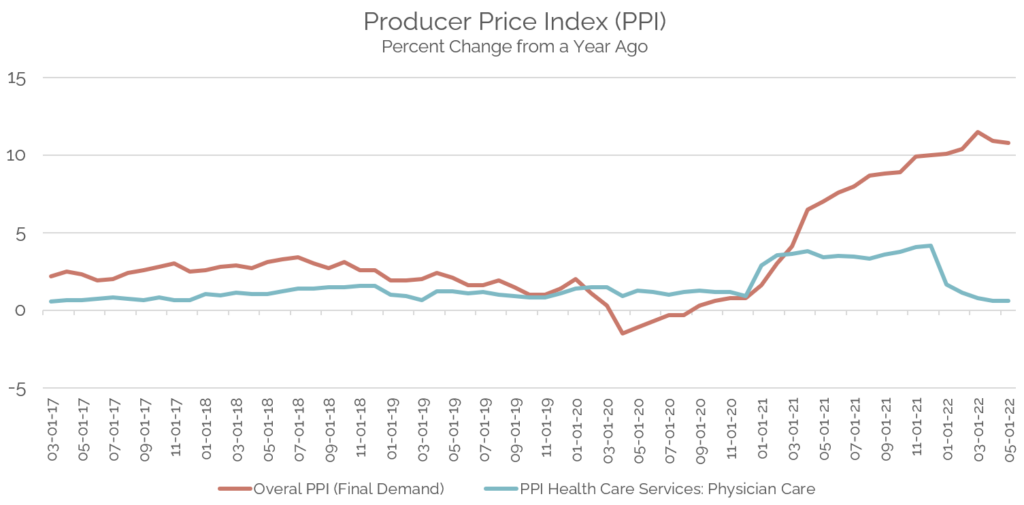
The Producer Price Index (PPI), which measures change in the prices paid to US producers of goods and services, continues to reflect the intense inflation being seen across many industries. For healthcare services and physician care, the PPI has yet to show much of a blip. Annual change for all goods and services remains high at 10.8% while physician services slowed to .6% from a year ago. For reference, the PPI for physician care encompasses Medicare, Medicaid, private insurance and all other patients. Insurance reimbursement rates are typically negotiated once per year and these new rates go into effect in January. Looking at the annual index changes, this is reflected as the biggest jumps are almost always in the month of January. So while inflation has climbed to record levels this year and we now know it is not transitory, insurance rates for the year have already been set. Throughout this year, the cost for basic supplies, salaries and rent are increasing, but physician payment for services is not. This is very likely causing financial pressure physician practices. Once new rates are negotiated and go into effect in January, assuming they go up more aggressively, those practices may find it easier to cover their costs – including rent and rent bumps. Stay tuned to Revista to see how this impacts trends moving forward!

Producer Price Index over the past year
Source: Bureau of Labor Statistics, www.bls.gov
Hilda Martin
Hilda Martin

Other Articles by Hilda Martin:

    • MOB On Campus or Community Based? Opinions Differ by Owner Type.
    • New Reports Available – Pivotal x Revista
    • Population Growth = More Demand for MOB Space

Previous Post:Inflationary Pressures Impacting the Revista MOB Industry Fundamentals Report
Next Post:MOB Construction OutlookTop 125 Metro Trends

Sidebar

Topics

  • Construction/Development
  • Industry News
  • Leasing/Property Management
  • Mergers/Acquisitions
  • Policy/Legislation
  • Real Estate Financing/Capital Markets
  • Revista Best Practices
  • Revista News
  • Sponsor Spotlight
  • Transactions
  • Uncategorized

Archives

RSS Recent Blog Posts

  • Limited Transaction Volume to Start 2025 April 29, 2025
    The preliminary 1Q25 numbers are in, and they show that transaction volume has been slow to kick off the year. $1.5 billion worth of MOBs traded in the 1st quarter, and $8.9 billion traded over the past year. This suppressed level of activity is . . . The post Limited Transaction Volume to Start 2025 […]
    Stephen Lindsey
  • A Look at 1Q25’s highest occupied Medical Office Market April 28, 2025
    That’s right!  With a 1Q25 occupancy of 96.9%, Asheville NC is the highest occupied market of the largest 125 metros RevistaMed tracks each quarter.  Asheville, which is still recovering from the effects of Hurricane Helene in September of 2024, can find strength within its healthcare market and within the MOB sector. The post A Look […]
    Mike Hargrave
  • Rising Rents for Newly Built MOBs March 31, 2025
    How have rising construction costs affected rents? Revista’s construction data continues to show increases in the cost of building an MOB. The average cost per square foot came in at $549 for completed MOBs in 2024. That is a . . . The post Rising Rents for Newly Built MOBs appeared first on RevistaMed.
    Stephen Lindsey
  • Cap Rates by Property Price February 28, 2025
    Typically, the transaction stats we look at are only for MOB trades that are at least $2.5 million. However, we do have data on a solid portion of the smaller deals. In the chart below we compare cap rates based on the property price, including those under $2.5M . . . The post Cap Rates […]
    Stephen Lindsey

Other Free Resources

Industry Directory

Search for and/or list your medical real estate services in Revista’s medical real estate directory.

Reports & White Papers

Download free reports & white papers on medical real estate.

Add Lease/Sale Listing

Revista provides free lease/sale listings for healthcare real estate.

Ready to Schedule a Demo?

Get in Touch Now
  • Why Subscribe?
  • Events
  • The MOB Scene
  • Add A Directory Listing
  • Add Lease/Sale Listing
  • Contact Us
  • Sponsorship
  • About
  • Data Terms of Use
  • Sponsorship Terms
  • Press

SIGN UP FOR MOB SCENE NEWSLETTER

  • Twitter
  • Facebook
  • LinkedIn