• Skip to main content
  • Skip to header right navigation
  • Skip to site footer
  • Blog
  • Free Resources
RevistaMed

RevistaMed

  • About
    • Meet Revista
    • Advisory Board
    • Partners
    • Press
    • Rising Leaders Council
    • Sponsorship
    • Contact Us
  • Events
    • 2025 Revista Medical Real Estate Investment Forum
    • Subscriber Webinar
  • Why Subscribe?
    • Revista x Pivotal
    • Featured Products
    • Business Development
    • Underwriting & Due Diligence
    • Asset Management
    • Capital Markets
    • Site Selection & Development
    • Leasing
  • Subscriber Login
Home / Construction/Development / Population Growth = More Demand for MOB Space

Population Growth = More Demand for MOB Space

July 30, 2024 by Hilda Martin Topics: Construction/Development, Leasing/Property Management, Real Estate Financing/Capital Markets

When developing an investment strategy, many investors will focus on geographic areas that have a high level of population growth. But does population growth translate into more demand for space? (Spoiler alert – the answer is yes!)

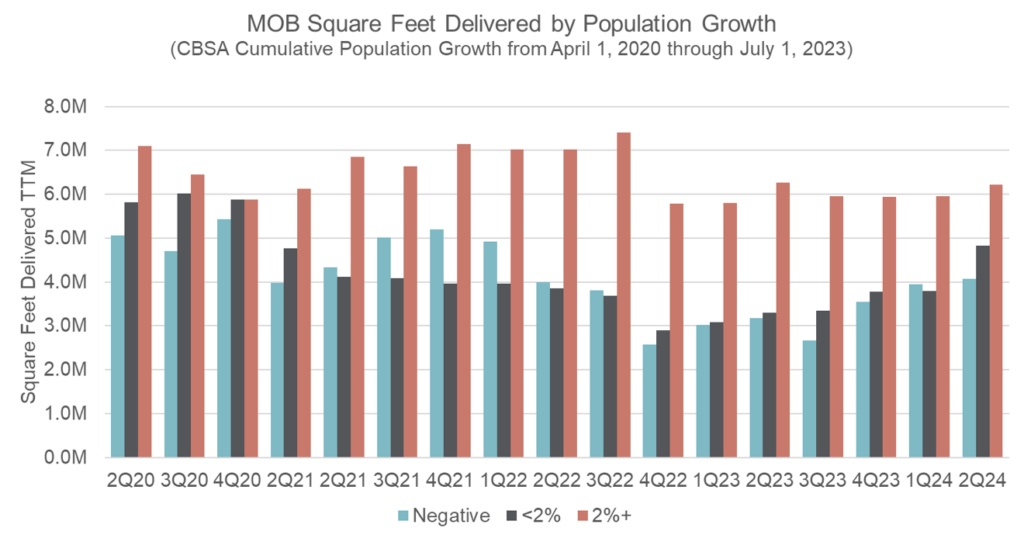
The Census Bureau released metro level data showing cumulative population growth from April 1, 2020 through July 1, 2023 in an effort to show population changes since the Pandemic shutdowns. We used this data to segment the top 125 metro areas into 3 groups: metros that lost population, stayed relatively flat, or gained 2% or more during that period. For reference, the U.S. as a whole grew 1% during that time. The metros that lost the most population tended to be bigger metros like Los Angeles, Chicago, New York and San Francisco, and the metros that gained the most population tended to be smaller to midsize metros in the sunbelt like Lakeland, Port St. Lucie, Cape Coral and Myrtle Beach.

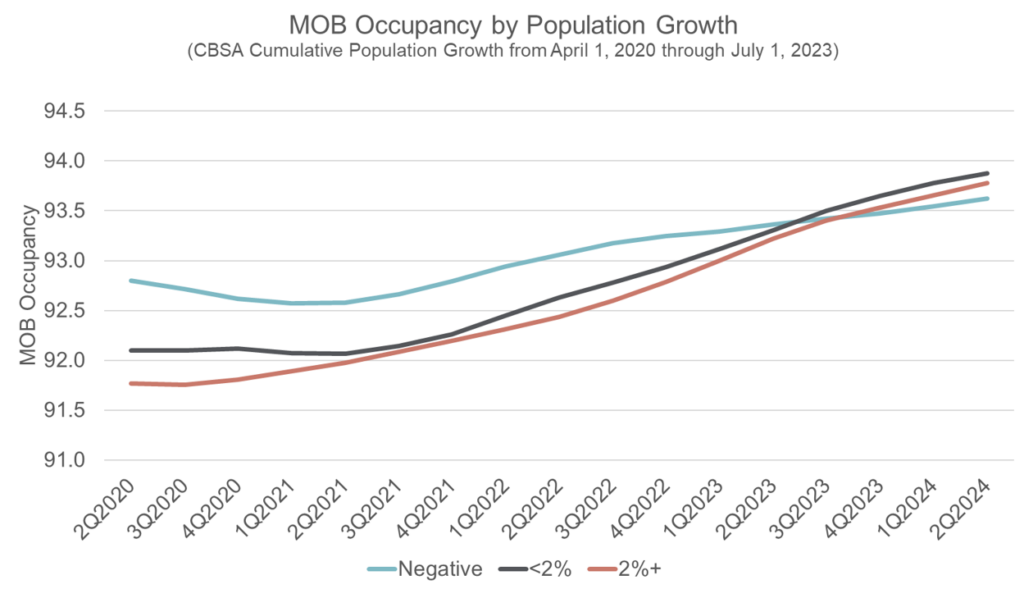
Volume of construction deliveries in metros that grew 2% or more was significantly higher than those metros that lost population or stayed the same. In the last three years, 19.5 million SF was delivered in the growth markets vs. 11.2 million SF in the negative growth markets. This is even more pronounced as the growth markets have overall lower population. In terms of absorption of this inventory, growth markets have absorbed this plus more. In 2020, there was a spread of 110 bps between occupancy in the 2%+ markets and the negative markets. Over the past few years that gap has completely closed with growth markets surpassing in occupancy gains. Want to know where your market stands? Check out our Metro Rankings!

Hilda Martin
Hilda Martin

Other Articles by Hilda Martin:

    • MOB On Campus or Community Based? Opinions Differ by Owner Type.
    • New Reports Available – Pivotal x Revista
    • Product Feature – Entity Search

Previous Post:Which Markets have the Largest Construction Pipeline Relative to Their Size?
Next Post:2Q2024 Snapshot

Sidebar

Topics

  • Construction/Development
  • Industry News
  • Leasing/Property Management
  • Mergers/Acquisitions
  • Policy/Legislation
  • Real Estate Financing/Capital Markets
  • Revista Best Practices
  • Revista News
  • Sponsor Spotlight
  • Transactions
  • Uncategorized

Archives

RSS Recent Blog Posts

  • Limited Transaction Volume to Start 2025 April 29, 2025
    The preliminary 1Q25 numbers are in, and they show that transaction volume has been slow to kick off the year. $1.5 billion worth of MOBs traded in the 1st quarter, and $8.9 billion traded over the past year. This suppressed level of activity is . . . The post Limited Transaction Volume to Start 2025 […]
    Stephen Lindsey
  • A Look at 1Q25’s highest occupied Medical Office Market April 28, 2025
    That’s right!  With a 1Q25 occupancy of 96.9%, Asheville NC is the highest occupied market of the largest 125 metros RevistaMed tracks each quarter.  Asheville, which is still recovering from the effects of Hurricane Helene in September of 2024, can find strength within its healthcare market and within the MOB sector. The post A Look […]
    Mike Hargrave
  • Rising Rents for Newly Built MOBs March 31, 2025
    How have rising construction costs affected rents? Revista’s construction data continues to show increases in the cost of building an MOB. The average cost per square foot came in at $549 for completed MOBs in 2024. That is a . . . The post Rising Rents for Newly Built MOBs appeared first on RevistaMed.
    Stephen Lindsey
  • Cap Rates by Property Price February 28, 2025
    Typically, the transaction stats we look at are only for MOB trades that are at least $2.5 million. However, we do have data on a solid portion of the smaller deals. In the chart below we compare cap rates based on the property price, including those under $2.5M . . . The post Cap Rates […]
    Stephen Lindsey

Other Free Resources

Industry Directory

Search for and/or list your medical real estate services in Revista’s medical real estate directory.

Reports & White Papers

Download free reports & white papers on medical real estate.

Add Lease/Sale Listing

Revista provides free lease/sale listings for healthcare real estate.

Ready to Schedule a Demo?

Get in Touch Now
  • Why Subscribe?
  • Events
  • The MOB Scene
  • Add A Directory Listing
  • Add Lease/Sale Listing
  • Contact Us
  • Sponsorship
  • About
  • Data Terms of Use
  • Sponsorship Terms
  • Press

SIGN UP FOR MOB SCENE NEWSLETTER

  • Twitter
  • Facebook
  • LinkedIn