• Skip to main content
  • Skip to header right navigation
  • Skip to site footer
  • Blog
  • Free Resources
RevistaMed

RevistaMed

  • About
    • Meet Revista
    • Advisory Board
    • Partners
    • Press
    • Rising Leaders Council
    • Sponsorship
    • Contact Us
  • Events
    • 2025 Revista Medical Real Estate Investment Forum
    • Subscriber Webinar
  • Why Subscribe?
    • Revista x Pivotal
    • Featured Products
    • Business Development
    • Underwriting & Due Diligence
    • Asset Management
    • Capital Markets
    • Site Selection & Development
    • Leasing
  • Subscriber Login
Home / Construction/Development / San Jose & Las Vegas Top Markets for MOB Rent Growth

San Jose & Las Vegas Top Markets for MOB Rent Growth

August 30, 2022 by Hilda Martin Topics: Construction/Development, Leasing/Property Management

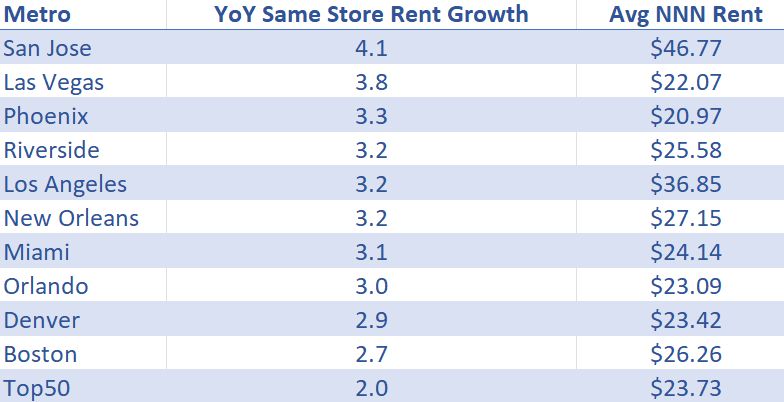
With continuing record inflation, the ability to raise rents is top of mind for many commercial real estate investors. One might be tempted to think that areas where overall inflation is the highest, rent growth would also be highest. For medical office buildings it’s not quite that simple. In many cases, demand for space is the bigger driver of rent growth. The areas where absorption of space is outpacing new supply are the areas where landlords and leasing agents are better able to raise rents. These dynamics can vary significantly from market to market. Out of the largest 50 metro areas, San Jose tops the list in terms of annual rent growth coming in at 4.1% year over year on a same store basis. This is more than two times the top 50 national average of 2%. San Jose has been seeing strong absorption and increasing occupancy since the second half of 2021. For reference, the Bay Area has been below the national average for overall inflation. Las Vegas, not far behind at 3.8% annual rent growth, has seen a significant increase in occupancy since it’s low point in 2020, climbing to 90% in the most recent quarter after a continuing spree of high absorption and relatively few deliveries. Going down the list, almost every metro in the top ten has seen this same dynamic of absorption outpacing new supply. In areas where this dynamic is reversed, whether related to softer demand or an influx of new supply, rent growth will be more limited and investors will feel the pressure – especially in those markets with higher inflation. Want to know where your market ranks? Subscribe to Revista!

*Data represents 2Q22
Source and Copyright: Revista. Data believed to be accurate but not guaranteed and is subject to future revision. Use of this data is permitted subject to terms and conditions detailed on data.revistamed.com/terms-of-use and with proper credit to Revista or Revistamed.com.
Hilda Martin
Hilda Martin

Other Articles by Hilda Martin:

    • MOB On Campus or Community Based? Opinions Differ by Owner Type.
    • New Reports Available – Pivotal x Revista
    • Population Growth = More Demand for MOB Space

Previous Post:The Medical Office Sector and GDP Growth
Next Post:MOB Occupancy Trends Across the Country

Sidebar

Topics

  • Construction/Development
  • Industry News
  • Leasing/Property Management
  • Mergers/Acquisitions
  • Policy/Legislation
  • Real Estate Financing/Capital Markets
  • Revista Best Practices
  • Revista News
  • Sponsor Spotlight
  • Transactions
  • Uncategorized

Archives

RSS Recent Blog Posts

  • Limited Transaction Volume to Start 2025 April 29, 2025
    The preliminary 1Q25 numbers are in, and they show that transaction volume has been slow to kick off the year. $1.5 billion worth of MOBs traded in the 1st quarter, and $8.9 billion traded over the past year. This suppressed level of activity is . . . The post Limited Transaction Volume to Start 2025 […]
    Stephen Lindsey
  • A Look at 1Q25’s highest occupied Medical Office Market April 28, 2025
    That’s right!  With a 1Q25 occupancy of 96.9%, Asheville NC is the highest occupied market of the largest 125 metros RevistaMed tracks each quarter.  Asheville, which is still recovering from the effects of Hurricane Helene in September of 2024, can find strength within its healthcare market and within the MOB sector. The post A Look […]
    Mike Hargrave
  • Rising Rents for Newly Built MOBs March 31, 2025
    How have rising construction costs affected rents? Revista’s construction data continues to show increases in the cost of building an MOB. The average cost per square foot came in at $549 for completed MOBs in 2024. That is a . . . The post Rising Rents for Newly Built MOBs appeared first on RevistaMed.
    Stephen Lindsey
  • Cap Rates by Property Price February 28, 2025
    Typically, the transaction stats we look at are only for MOB trades that are at least $2.5 million. However, we do have data on a solid portion of the smaller deals. In the chart below we compare cap rates based on the property price, including those under $2.5M . . . The post Cap Rates […]
    Stephen Lindsey

Other Free Resources

Industry Directory

Search for and/or list your medical real estate services in Revista’s medical real estate directory.

Reports & White Papers

Download free reports & white papers on medical real estate.

Add Lease/Sale Listing

Revista provides free lease/sale listings for healthcare real estate.

Ready to Schedule a Demo?

Get in Touch Now
  • Why Subscribe?
  • Events
  • The MOB Scene
  • Add A Directory Listing
  • Add Lease/Sale Listing
  • Contact Us
  • Sponsorship
  • About
  • Data Terms of Use
  • Sponsorship Terms
  • Press

SIGN UP FOR MOB SCENE NEWSLETTER

  • Twitter
  • Facebook
  • LinkedIn