• Skip to main content
  • Skip to header right navigation
  • Skip to site footer
  • Blog
  • Free Resources
RevistaMed

RevistaMed

  • About
    • Meet Revista
    • Advisory Board
    • Partners
    • Press
    • Rising Leaders Council
    • Sponsorship
    • Contact Us
  • Events
    • 2026 Revista Medical Real Estate Investment Forum
    • Subscriber Webinar
  • Why Subscribe?
    • Schedule a Demo
    • Featured Products
    • Business Development
    • Underwriting & Due Diligence
    • Asset Management
    • Capital Markets
    • Site Selection & Development
    • Leasing
  • Subscriber Login
Home / Industry News / The Return of the Portfolio Premium

The Return of the Portfolio Premium

May 27, 2025 by Mike Hargrave Topics: Industry News, Mergers/Acquisitions, Real Estate Financing/Capital Markets, Revista Best Practices

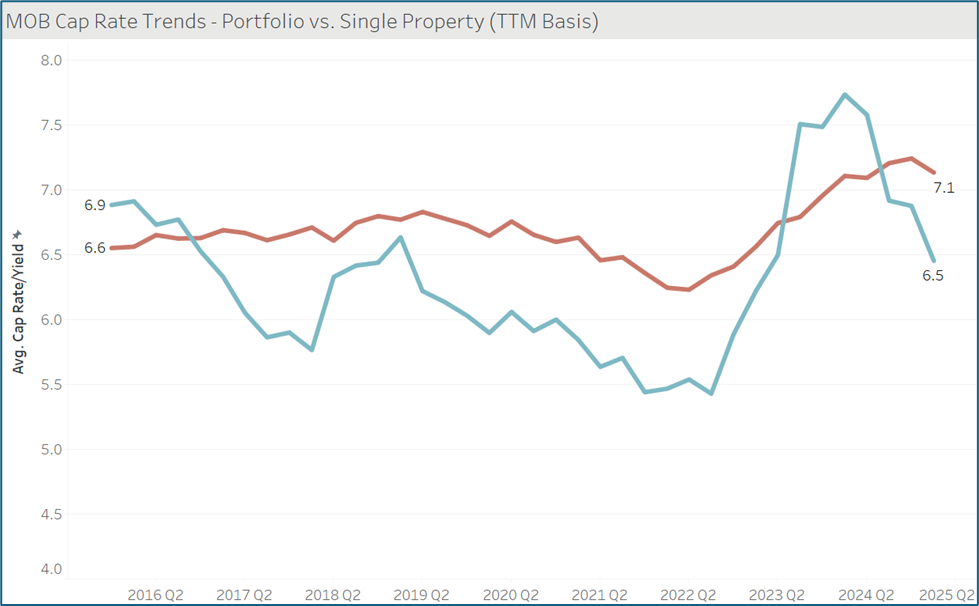
For many investors in Medical Office Buildings (MOBs), the concept of a portfolio premium has helped to drive an aggregation strategy.  The idea is that, in addition to synergies developed from operations of portfolios vs. single properties, that portfolios also carry higher valuations compared to single MOBs.  The data generally supports this thesis over time.  The graph below displays Average MOB cap rate trends for Portfolios vs. Single Properties.  From 2017 through 2022, the Average Cap Rate for MOB Portfolios was 63 basis points lower than single MOB properties that traded.  This was generally considered the portfolio premium that developed during that period.  This premium essentially disappeared in late 2023 when interest rates began to spike.  Transaction activity slowed measurably and during the following year+ portfolios were trading at a discount relative to single properties.  But in the second half of 2024 the portfolio premium began to emerge again.  We have seen several portfolios trade since then and it is clear the portfolio premium is returning to the MOB investment landscape.  As of 1Q25, MOB portfolios garnered an average TTM cap rate of 6.5% while single properties were at 7.1%. 

Will this continue?  Tune in to RevistaMed.com as we will monitor this emerging trend. 

Interested in a subscription to RevistaMed.com?  Schedule a demo today!

Or contact Mike Hargrave at mike@revistacompanies.com

Mike Hargrave
Mike Hargrave

Other Articles by Mike Hargrave:

    • The Divergence in Base Rent Trends
    • Here Are the Most Active Metros for MOB Transactions
    • MOB Occupancy Rate Hovering at Cyclical High 

Previous Post:Limited Transaction Volume to Start 2025
Next Post:MOB Construction Update

Sidebar

Topics

  • Construction/Development
  • Industry News
  • Leasing/Property Management
  • Mergers/Acquisitions
  • Policy/Legislation
  • Real Estate Financing/Capital Markets
  • Revista Best Practices
  • Revista News
  • Sponsor Spotlight
  • Transactions
  • Uncategorized

Archives

RSS Recent Blog Posts

  • Hospital Construction Pipeline Swells to 79M Square Feet December 22, 2025
    The amount of hospital space under construction is continuing a multi-year climb, now at a level of 79 million square feet. With an estimated value of $93 billion, the . . . The post Hospital Construction Pipeline Swells to 79M Square Feet appeared first on RevistaMed.
    Stephen Lindsey
  • The Divergence in Base Rent Trends December 22, 2025
    The idea of a K-Shaped economy is a much talked about topic these days. The concept is that higher earners are doing quite well while those in lower to middle income brackets are struggling with stagnant wages and higher costs. The post The Divergence in Base Rent Trends appeared first on RevistaMed.
    Mike Hargrave
  • Which MOB Markets have the Most Concentrated Ownership? November 21, 2025
    To answer this, we analyzed how MOB square footage is spread across all the owners in each of the top 125 markets. The chart below lists the most concentrated markets, with . . . The post Which MOB Markets have the Most Concentrated Ownership? appeared first on RevistaMed.
    Stephen Lindsey
  • Here Are the Most Active Metros for MOB Transactions November 20, 2025
    RevistaMed tracks medical office (or medical outpatient) building transaction activity across the US and has a time series back to 2013. The post Here Are the Most Active Metros for MOB Transactions appeared first on RevistaMed.
    Mike Hargrave

Other Free Resources

Industry Directory

Search for and/or list your medical real estate services in Revista’s medical real estate directory.

Reports & White Papers

Download free reports & white papers on medical real estate.

Add Lease/Sale Listing

Revista provides free lease/sale listings for healthcare real estate.

Ready to Schedule a Demo?

Get in Touch Now
  • Why Subscribe?
  • Events
  • The MOB Scene
  • Add A Directory Listing
  • Add Lease/Sale Listing
  • Contact Us
  • Sponsorship
  • About
  • Data Terms of Use
  • Sponsorship Terms
  • Press

SIGN UP FOR MOB SCENE NEWSLETTER

  • Twitter
  • Facebook
  • LinkedIn