• Skip to main content
  • Skip to header right navigation
  • Skip to site footer
  • Blog
  • Free Resources
RevistaMed

RevistaMed

  • About
    • Meet Revista
    • Advisory Board
    • Partners
    • Press
    • Rising Leaders Council
    • Sponsorship
    • Contact Us
  • Events
    • 2025 Revista Medical Real Estate Investment Forum
    • Subscriber Webinar
  • Why Subscribe?
    • Revista x Pivotal
    • Featured Products
    • Business Development
    • Underwriting & Due Diligence
    • Asset Management
    • Capital Markets
    • Site Selection & Development
    • Leasing
  • Subscriber Login
Home / Construction/Development / Inpatient Facility Construction Showed Strength in 2024

Inpatient Facility Construction Showed Strength in 2024

January 30, 2025 by Stephen Lindsey Topics: Construction/Development, Leasing/Property Management

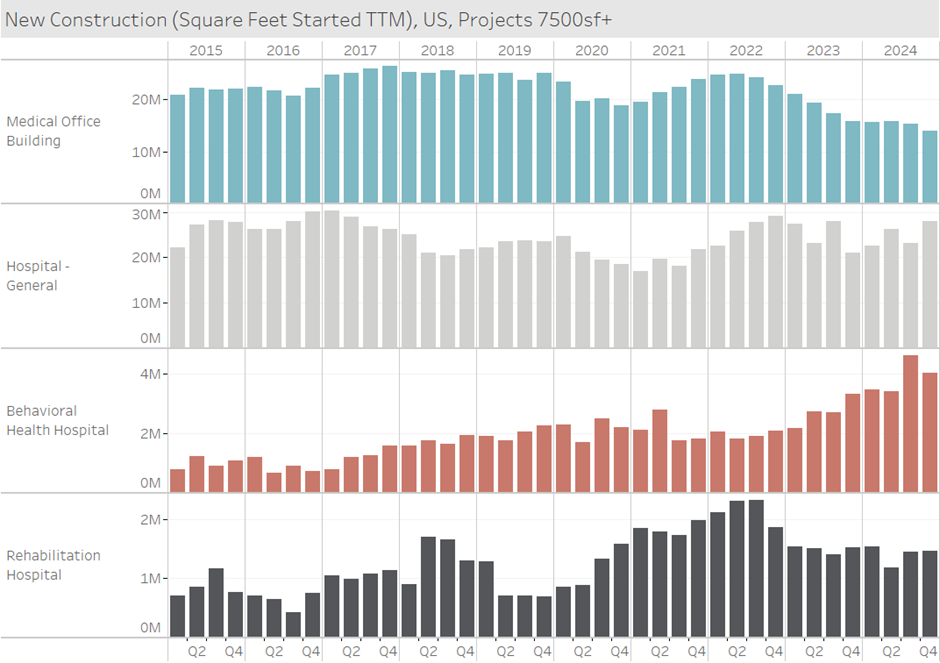
The amount of new MOB construction has fallen since the peak in 2022, and the back end of 2024 was no exception. With right around 14 million sf breaking ground in 2024, the blue bar chart clearly shows 2024 had less than typical construction starts compared to the past decade. While new projects getting started have declined, the square footage that is completing and opening for business is fairly normal, due to the influx of new projects in 2022. However, once the lack of new projects pulls the pipeline to a lower level, we could see inventory growth slow down temporarily. This could allow occupancy to maintain the upward march we have witnessed over the past few years.

The story has been different on the inpatient side. General hospitals have maintained an average level of new construction. Interestingly, the past few years have had a lower number of projects, but the average project size has been higher. Behavioral health construction was the strongest it’s been, with over 4 million sf breaking ground in 2024. Rehab Hospitals show a similar amount of construction as 2023, which is historically high, but lower compared to 2021 and 2022. Despite high construction costs, there is still a lot going on in the development world, so stay tuned as we continue to monitor the direction of the market.

Stephen Lindsey

Other Articles by Stephen Lindsey:

    • Limited Transaction Volume to Start 2025
    • Rising Rents for Newly Built MOBs
    • Cap Rates by Property Price

Previous Post:Occupancy in Outpatient Medical Rides High in “Tertiary” Real Estate Markets
Next Post:MOB On Campus or Community Based? Opinions Differ by Owner Type.

Sidebar

Topics

  • Construction/Development
  • Industry News
  • Leasing/Property Management
  • Mergers/Acquisitions
  • Policy/Legislation
  • Real Estate Financing/Capital Markets
  • Revista Best Practices
  • Revista News
  • Sponsor Spotlight
  • Transactions
  • Uncategorized

Archives

RSS Recent Blog Posts

  • Limited Transaction Volume to Start 2025 April 29, 2025
    The preliminary 1Q25 numbers are in, and they show that transaction volume has been slow to kick off the year. $1.5 billion worth of MOBs traded in the 1st quarter, and $8.9 billion traded over the past year. This suppressed level of activity is . . . The post Limited Transaction Volume to Start 2025 […]
    Stephen Lindsey
  • A Look at 1Q25’s highest occupied Medical Office Market April 28, 2025
    That’s right!  With a 1Q25 occupancy of 96.9%, Asheville NC is the highest occupied market of the largest 125 metros RevistaMed tracks each quarter.  Asheville, which is still recovering from the effects of Hurricane Helene in September of 2024, can find strength within its healthcare market and within the MOB sector. The post A Look […]
    Mike Hargrave
  • Rising Rents for Newly Built MOBs March 31, 2025
    How have rising construction costs affected rents? Revista’s construction data continues to show increases in the cost of building an MOB. The average cost per square foot came in at $549 for completed MOBs in 2024. That is a . . . The post Rising Rents for Newly Built MOBs appeared first on RevistaMed.
    Stephen Lindsey
  • Cap Rates by Property Price February 28, 2025
    Typically, the transaction stats we look at are only for MOB trades that are at least $2.5 million. However, we do have data on a solid portion of the smaller deals. In the chart below we compare cap rates based on the property price, including those under $2.5M . . . The post Cap Rates […]
    Stephen Lindsey

Other Free Resources

Industry Directory

Search for and/or list your medical real estate services in Revista’s medical real estate directory.

Reports & White Papers

Download free reports & white papers on medical real estate.

Add Lease/Sale Listing

Revista provides free lease/sale listings for healthcare real estate.

Ready to Schedule a Demo?

Get in Touch Now
  • Why Subscribe?
  • Events
  • The MOB Scene
  • Add A Directory Listing
  • Add Lease/Sale Listing
  • Contact Us
  • Sponsorship
  • About
  • Data Terms of Use
  • Sponsorship Terms
  • Press

SIGN UP FOR MOB SCENE NEWSLETTER

  • Twitter
  • Facebook
  • LinkedIn