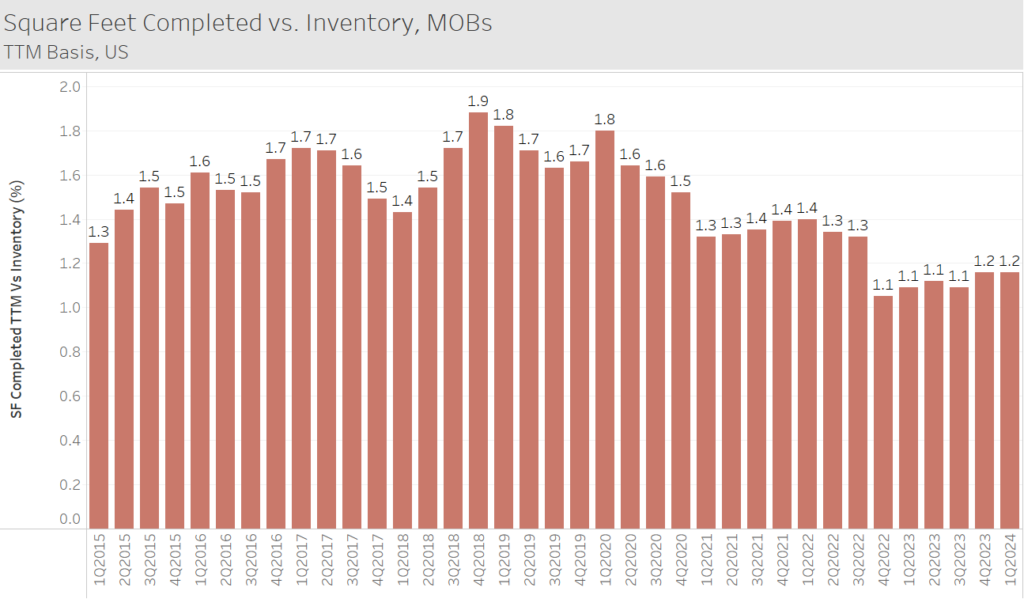
Over the past year or two, new construction projects have faced the headwinds of elevated labor, material, and financing costs. Because of this, we are now seeing inventory growth running at a slower pace. The graph below shows the amount of MOB square footage that finished construction on an annual basis, as a percentage of the inventory. The average over the past 10 years is about 1.5%. Recently, inventory growth has been lower, around 1.1% – 1.2%. Owners of existing MOBs can benefit from the change in balance between supply and demand. The growth in the demand for healthcare and healthcare space has not decreased. The absorption of space has been higher than the delivery of new supply, and as a result, the overall occupancy rate for the U.S. has been climbing. Occupancy in the largest 100 metro areas is currently 92.5%, which is over 120 basis points higher than it was in early 2021. Will this trend continue? Since the quantity of new projects has continued to decrease, it is possible that the market progressively tightens. Only time will tell, so stay tuned to get the latest updates.


