• Skip to main content
  • Skip to header right navigation
  • Skip to site footer
  • Blog
  • Free Resources
RevistaMed

RevistaMed

  • About
    • Meet Revista
    • Advisory Board
    • Partners
    • Press
    • Rising Leaders Council
    • Sponsorship
    • Contact Us
  • Events
    • 2026 Revista Medical Real Estate Investment Forum
    • Subscriber Webinar
  • Why Subscribe?
    • Schedule a Demo
    • Featured Products
    • Business Development
    • Underwriting & Due Diligence
    • Asset Management
    • Capital Markets
    • Site Selection & Development
    • Leasing
  • Subscriber Login
Home / Construction/Development / MOB Occupancy Rate Hovering at Cyclical High 

MOB Occupancy Rate Hovering at Cyclical High 

October 30, 2025 by Mike Hargrave Topics: Construction/Development, Industry News, Leasing/Property Management

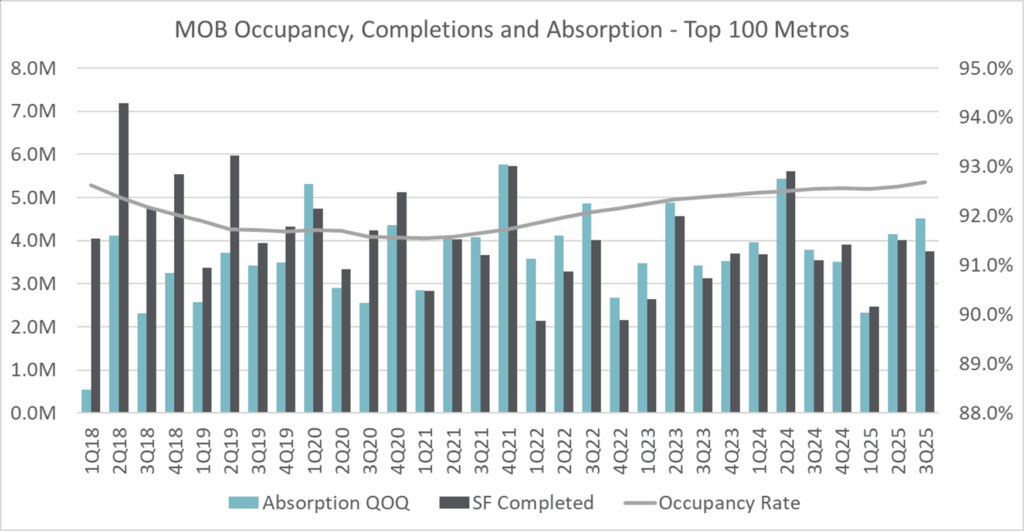
The Medical Outpatient Building or Medical Office Building sector (both MOB) is at a cyclical high in 3Q25.  At 92.7% across the nation’s largest 100 metro areas, the MOB occupancy rate is up 10 basis points (bps) Q/Q and 20 bps Y/Y.  The MOB occupancy rate has been slowly rising but generally hovering between 92.4% and 92.7% for the past 2 years.  It appears that it is bouncing around an imaginary ceiling of occupancy.  Many of the markets Revista tracks are very tight with 20 of the top 100 metros boasting occupancy of over 95% as of 3Q25.  Baton Rouge was the highest occupied market at 97% occupancy.  Daytona beach rose the most Y/Y, its occupancy rate rose 210 bps from 94.1% in 3Q24 to 96.2% in 3Q25.  The Provo-Orem CBSA fell the most Y/Y.  Its occupancy rate fell 280 bps from 96.4% in 3Q24 to 93.6% in 3Q25.  

Subscribers can access the Revista rankings and Trends for these stats.  Its located here https://data.revistamed.com/Pages/MetroRankings.  For more information or for subscription information please reach out to Mike Hargrave at mike@revistacompanies.com or schedule a demo at https://revistamed.com/schedule-a-demo/. .

Mike Hargrave
Mike Hargrave

Other Articles by Mike Hargrave:

    • Here Are the Most Active Metros for MOB Transactions
    • Is MOB Construction Beginning to Rise?
    • Rehabilitation hospital construction showing signs of rising in 2025

Previous Post:Fundamentals in Fast Growing Core Markets
Next Post:Sales Activity Across Different Types of Healthcare Real Estate

Sidebar

Topics

  • Construction/Development
  • Industry News
  • Leasing/Property Management
  • Mergers/Acquisitions
  • Policy/Legislation
  • Real Estate Financing/Capital Markets
  • Revista Best Practices
  • Revista News
  • Sponsor Spotlight
  • Transactions
  • Uncategorized

Archives

RSS Recent Blog Posts

Other Free Resources

Industry Directory

Search for and/or list your medical real estate services in Revista’s medical real estate directory.

Reports & White Papers

Download free reports & white papers on medical real estate.

Add Lease/Sale Listing

Revista provides free lease/sale listings for healthcare real estate.

Ready to Schedule a Demo?

Get in Touch Now
  • Why Subscribe?
  • Events
  • The MOB Scene
  • Add A Directory Listing
  • Add Lease/Sale Listing
  • Contact Us
  • Sponsorship
  • About
  • Data Terms of Use
  • Sponsorship Terms
  • Press

SIGN UP FOR MOB SCENE NEWSLETTER

  • Twitter
  • Facebook
  • LinkedIn