• Skip to main content
  • Skip to header right navigation
  • Skip to site footer
  • Blog
  • Free Resources
RevistaMed

RevistaMed

  • About
    • Meet Revista
    • Advisory Board
    • Partners
    • Press
    • Rising Leaders Council
    • Sponsorship
    • Contact Us
  • Events
    • Annual Events
    • Subscriber Webinar
  • Why Subscribe?
    • Schedule a Demo
    • Featured Products
    • Business Development
    • Underwriting & Due Diligence
    • Asset Management
    • Capital Markets
    • Site Selection & Development
    • Leasing
  • Subscriber Login
Home / Mergers/Acquisitions / Sales Activity Across Different Types of Healthcare Real Estate

Sales Activity Across Different Types of Healthcare Real Estate

October 31, 2025 by Stephen Lindsey Topics: Mergers/Acquisitions, Policy/Legislation, Real Estate Financing/Capital Markets

Medical real estate seems to be in a tide shift when it comes to sales activity. With a second 25-bps cut in the federal funds rate and the announcement of the Remedy/Welltower transaction, we already know 4Q volumes are going to exceed the quarterly levels we witnessed during the first ¾ of the year. Despite the excitement for what is ahead, here we are reflecting on what has gone on across more than just MOBs during the last year.

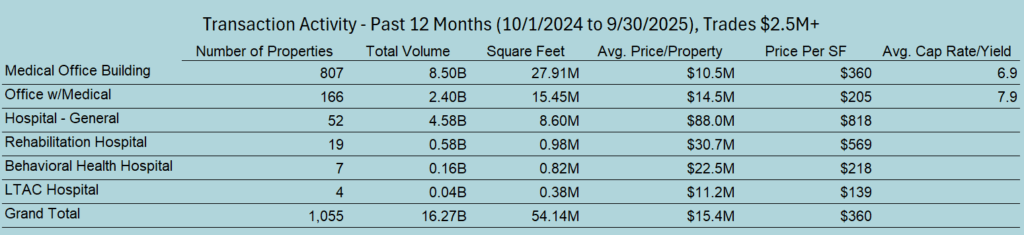
From the main property types that we track, we have seen 1,055 properties trade for a total of 54 million square feet and $16.3 billion. MOBs made up over half of that dollar volume, with General Hospitals and Office w/Medical taking up the bulk of what remained. Only a handful of specialty hospitals traded, with rehab seeing the most activity out of that subgroup. MOB cap rates averaged 6.9, showing a premium of 100 basis points compared to the mixed Office w/Medical property type.

Will these numbers change drastically one year from now? For reference, the average combined annual volume for these property types from 2016-2024 was $24 billion for 75 million square feet. So, 2025 activity ran around 2/3 of the average. Only time will tell, but make sure to keep your eyes peeled, because the coming year is set for more movement than we have seen lately.

Stephen Lindsey

Other Articles by Stephen Lindsey:

    • Which Counties are Rapidly Increasing Healthcare Output?
    • 2026 Outpatient Development Report Recap
    • Medical Office Rent Growth Normalizes Post Inflation

Previous Post:MOB Occupancy Rate Hovering at Cyclical High 
Next Post:Here Are the Most Active Metros for MOB Transactions

Sidebar

Topics

  • Construction/Development
  • Industry News
  • Leasing/Property Management
  • Mergers/Acquisitions
  • Policy/Legislation
  • Real Estate Financing/Capital Markets
  • Revista Best Practices
  • Revista News
  • Sponsor Spotlight
  • Transactions
  • Uncategorized

Archives

RSS Recent Blog Posts

  • Which Counties are Rapidly Increasing Healthcare Output? April 29, 2026
    Healthcare Gross Domestic Product (HGDP) is measure of the monetary value of healthcare output. In the charts above, we are looking at growth in real HGDP for each county over the past decade. Real HGDP is inflation adjusted to provide a better view on . . . The post Which Counties are Rapidly Increasing Healthcare […]
    Stephen Lindsey
  • Which Markets Have Seen the Greatest Growth in MOB Face Rents? April 28, 2026
    The Medical Office Sector has typically averaged 2 to 3 percent year-to-year rent growth. In recent years, this level of growth has often trailed CPI inflation. As a result, investors often target medical office (or outpatient) buildings (MOBs) that have a likelihood for higher year to year rent growth. These targets will likely include markets […]
    Mike Hargrave
  • 2026 Outpatient Development Report Recap March 31, 2026
    The annual outpatient development report is now available. Produced with collaboration from HREI (Healthcare Real Estate Insights), the 2026 report covers all the outpatient construction projects that broke ground or . . . The post 2026 Outpatient Development Report Recap appeared first on RevistaMed.
    Stephen Lindsey
  • Update on Health System Medical Outpatient Building Buybacks March 27, 2026
    Health systems have been one of the most active participants in the medical properties investment sales market in the last 3 years, accounting for 17% of all sales activity as either the buyer or seller.  In 2025 alone . . . The post Update on Health System Medical Outpatient Building Buybacks appeared first on RevistaMed.
    Mindy Berman

Other Free Resources

Industry Directory

Search for and/or list your medical real estate services in Revista’s medical real estate directory.

Reports & White Papers

Download free reports & white papers on medical real estate.

Add Lease/Sale Listing

Revista provides free lease/sale listings for healthcare real estate.

Ready to Schedule a Demo?

Get in Touch Now
  • Why Subscribe?
  • Events
  • The MOB Scene
  • Add A Directory Listing
  • Add Lease/Sale Listing
  • Contact Us
  • Sponsorship
  • About
  • Data Terms of Use
  • Sponsorship Terms
  • Press

SIGN UP FOR MOB SCENE NEWSLETTER

  • This field is for validation purposes and should be left unchanged.
  • Twitter
  • Facebook
  • LinkedIn