• Skip to main content
  • Skip to header right navigation
  • Skip to site footer
  • Blog
  • Free Resources
RevistaMed

RevistaMed

  • About
    • Meet Revista
    • Advisory Board
    • Partners
    • Press
    • Rising Leaders Council
    • Sponsorship
    • Contact Us
  • Events
    • 2025 Revista Medical Real Estate Investment Forum
    • Subscriber Webinar
  • Why Subscribe?
    • Revista x Pivotal
    • Featured Products
    • Business Development
    • Underwriting & Due Diligence
    • Asset Management
    • Capital Markets
    • Site Selection & Development
    • Leasing
  • Subscriber Login
Home / Industry News / Outpatient Real Estate Sector Riding a Wave of Strength!

Outpatient Real Estate Sector Riding a Wave of Strength!

December 10, 2024 by Mike Hargrave Topics: Construction/Development, Industry News, Leasing/Property Management, Real Estate Financing/Capital Markets, Transactions

The outpatient real estate sector is large and diverse. The terms Medical Office Building (MOB) or Medical Outpatient Building (also MOB) are often used to describe the main property types in the outpatient sector. In all, the MOB sector comprises over 1.6 billion square feet (SF) across the continental United States.

The MOB sector has been a benefactor of several long-term secular trends such as an aging population (yes, older adults visit the doctor more often) and advances in technologies that have enabled many former inpatient procedures to be conducted in outpatient settings. These trends have created increasing demand for space within MOBs and have led to a healthy supply and demand balance for outpatient space.

At least this was the paradigm up to the recent Covid-19 pandemic. But then things began to change.

Yes, the MOB sector was impacted during the initial shutdown stages of the pandemic as many physician offices closed during this stage. In fact, physician office employment fell by 11.1% from February of 2020 to April of 2020 (source, BLS, St Louis Fed). But while there was impact, it was not as severe as some other sectors and was quick to recover.

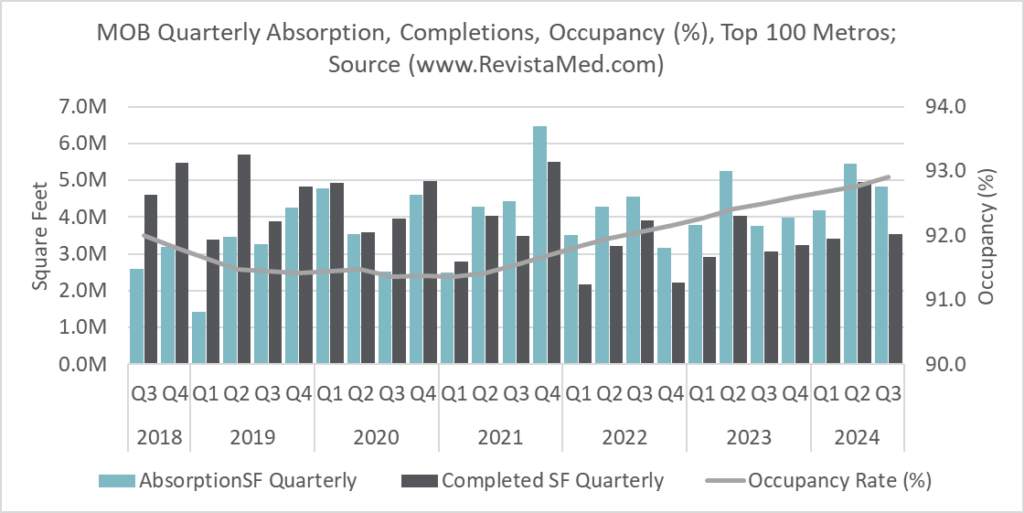
Real estate fundamentals during the pandemic were largely unimpacted as occupancy rates remained steady between a range of 91.4% to 91.5% from the middle of 2019 to the middle of 2021.  Construction or new deliveries experienced a slowdown that began during the pandemic.  Supply shortages led to increasing costs of lumber, steel and other construction materials which helped to slow new construction starts.

But after the middle of 2021 fundamentals began to change again within the MOB sector.  Physician office employment grew at a faster rate than before the pandemic.  This led to increasing demand for new space within MOBs.  Absorption (the change in occupied space) has averaged 4.4 million SF per quarter across the top 100 metros since the middle of 2021.  This is faster than the 3.4 million SF per quarter average prior to mid-2021. 

On the supply side, completions have slowed materially since and before the pandemic.  Prior to mid-2021, developers were delivering on average 4.3 million SF of MOB space across the top 100 metros.  Since then, the average has fallen to 3.5 million SF per quarter.   

So, demand has been outpacing supply since the pandemic.  The result has been increasing occupancies across the top 100 Metros.  The average occupancy rate has risen from that 91.4% range in mid-2021 to 92.9% as of the 3rd quarter of 2024.  The gains have been consistent, and a direct result of the trends outlined above.

When looking into 2025 there is reason to believe these trends will continue.  There is no sign that construction starts are going to rise.  Costs are still up, and finance rates have risen making it more difficult to make projects work.  Demand for new space should also continue into 2025.  The long-term secular trends are still in place and healthcare spending and employment continues to rise. 

This leads to compelling investment opportunities across the MOB sector.  Expect investment volumes to increase in 2025.  Hospitals and health systems are already increasing their real estate moves.  Will REITs and private investors increase their volumes in 2025?  Stay tuned as Revista will be here to track it in real time!

Mike Hargrave
Mike Hargrave

Other Articles by Mike Hargrave:

    • A Look at 1Q25’s highest occupied Medical Office Market
    • Off Campus MOBs Catching up to On Campus MOBs in the Top 50 Metros
    • Private Investors Net Buyers, REITs Net Sellers in 2024!

Previous Post:Health System Transaction Activity: Monetization vs Buybacks
Next Post:Occupancy in Outpatient Medical Rides High in “Tertiary” Real Estate Markets

Sidebar

Topics

  • Construction/Development
  • Industry News
  • Leasing/Property Management
  • Mergers/Acquisitions
  • Policy/Legislation
  • Real Estate Financing/Capital Markets
  • Revista Best Practices
  • Revista News
  • Sponsor Spotlight
  • Transactions
  • Uncategorized

Archives

RSS Recent Blog Posts

  • Limited Transaction Volume to Start 2025 April 29, 2025
    The preliminary 1Q25 numbers are in, and they show that transaction volume has been slow to kick off the year. $1.5 billion worth of MOBs traded in the 1st quarter, and $8.9 billion traded over the past year. This suppressed level of activity is . . . The post Limited Transaction Volume to Start 2025 […]
    Stephen Lindsey
  • A Look at 1Q25’s highest occupied Medical Office Market April 28, 2025
    That’s right!  With a 1Q25 occupancy of 96.9%, Asheville NC is the highest occupied market of the largest 125 metros RevistaMed tracks each quarter.  Asheville, which is still recovering from the effects of Hurricane Helene in September of 2024, can find strength within its healthcare market and within the MOB sector. The post A Look […]
    Mike Hargrave
  • Rising Rents for Newly Built MOBs March 31, 2025
    How have rising construction costs affected rents? Revista’s construction data continues to show increases in the cost of building an MOB. The average cost per square foot came in at $549 for completed MOBs in 2024. That is a . . . The post Rising Rents for Newly Built MOBs appeared first on RevistaMed.
    Stephen Lindsey
  • Cap Rates by Property Price February 28, 2025
    Typically, the transaction stats we look at are only for MOB trades that are at least $2.5 million. However, we do have data on a solid portion of the smaller deals. In the chart below we compare cap rates based on the property price, including those under $2.5M . . . The post Cap Rates […]
    Stephen Lindsey

Other Free Resources

Industry Directory

Search for and/or list your medical real estate services in Revista’s medical real estate directory.

Reports & White Papers

Download free reports & white papers on medical real estate.

Add Lease/Sale Listing

Revista provides free lease/sale listings for healthcare real estate.

Ready to Schedule a Demo?

Get in Touch Now
  • Why Subscribe?
  • Events
  • The MOB Scene
  • Add A Directory Listing
  • Add Lease/Sale Listing
  • Contact Us
  • Sponsorship
  • About
  • Data Terms of Use
  • Sponsorship Terms
  • Press

SIGN UP FOR MOB SCENE NEWSLETTER

  • Twitter
  • Facebook
  • LinkedIn