The Federal Reserve (Fed) yesterday released updated economic projections including their expectations for the Fed Funds rate. To look at the potential impact on MOB cap rates, let’s review recent history.
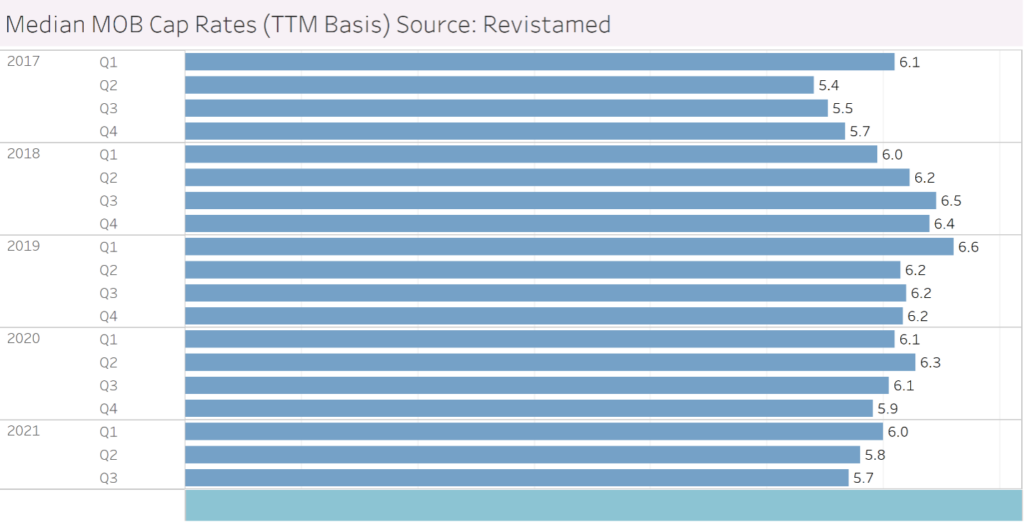
The current Fed Funds rate is .08% (rounds to .1%). This rate has been hovering at this level for about 18 months or so since the onset of the Covid-19 pandemic. Prior to that the Fed Funds rate was falling from 2.4% to around 1.5% during the middle of 2019 to just prior to the pandemic. From the 2018 to 2019 period the Fed Funds rate was slightly rising from 1.4% to 2.4%. At the same time, the 10 year Treasury yield was rising eventually establishing a high of 3.2% during November of 2018. What happened to MOB cap rates during this period? Well the median MOB cap rate rose from 6.0% in 1Q18 to 6.6% on 1Q19. The did start coming back down in 2019 to 6.2% while the Fed funds rate and Treasury rate were also falling.


The updated Fed economic projections are posted below. Generally they expect higher levels of inflation moving forward compared to earlier thinking in September. As a result, they now expect up to 3 interest rate hikes in 2022. In addition, they are going put an end to asset purchases as bit earlier than previously announced.
All things considered; a rising Fed Funds rate could lead the 10 year Treasury yield higher. We will see if that happens, and if it does, what happens to MOB cap rates
Economic projections of Federal Reserve Board members and Federal Reserve Bank presidents, under their individual assumptions of projected appropriate monetary policy, December 2021
| 2021 | 2022 | 2023 | |
| Change in Real GDP | 5.5 | 4.0 | 2.2 |
| September Projection | 5.9 | 3.8 | 2.5 |
| Unemployment Rate | 4.3 | 3.5 | 3.5 |
| September Projection | 4.8 | 3.8 | 3.5 |
| PCE Inflation | 5.3 | 2.6 | 2.3 |
| September Projection | 4.2 | 2.2 | 2.2 |
| Core PCE Inflation | 4.4 | 2.7 | 2.1 |
| September Projection | 3.7 | 2.3 | 2.1 |
| Fed Funds Rate | 0.1 | 0.9 | 1.6 |
| September Projection | 0.1 | 0.3 | 1.0 |

