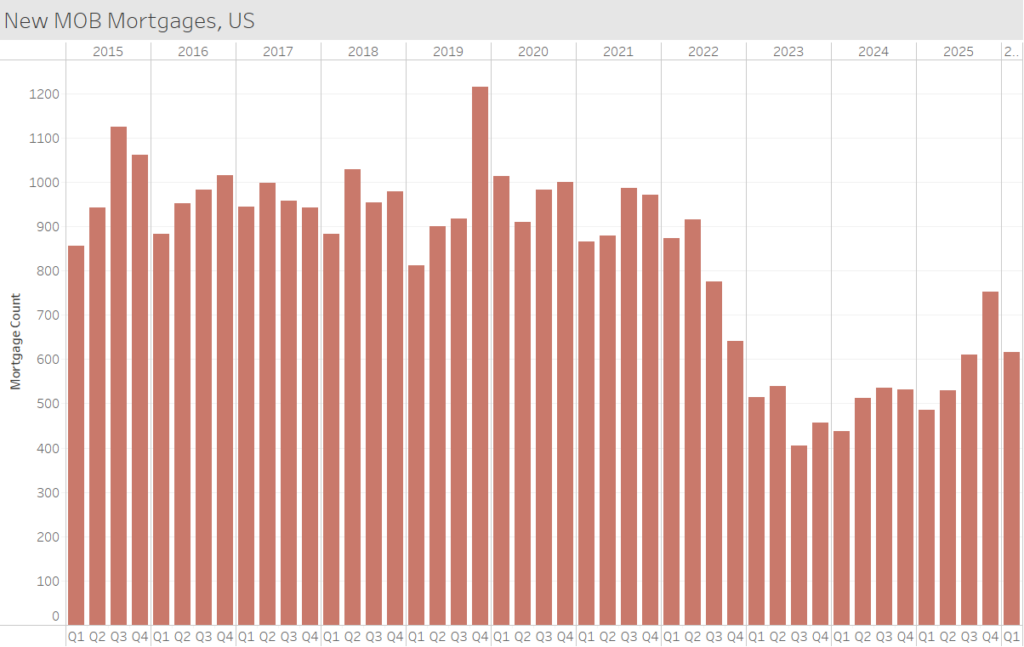
If you have been following medical office sales activity, you know that transaction volume is moving upwards. Another angle for viewing the financial environment is to look at the number of new mortgages. Looking at the mortgage trend below, we can see the first period in the chart is quite consistent. From 2015 to 2021, there was an average of 960 new mortgages a quarter and the annual totals were similar year to year. In 2022, when the FED started hiking rates the trend shifted and the number of mortgages dropped to about half of the previous level. The low point of financing activity was in 3Q23 with only 404 MOB mortgages.
Since then, activity has been steadily climbing with a recent peak at the end of 2025 (752 in Q4). The latest 1Q26 numbers are relatively strong, but they failed to continue the momentum from the prior quarter. The conflict in the Middle East, its effects on inflation, and the resulting monetary policy outlook is likely chipping away at activity. Preliminary transaction data indicates that the surge in activity from the close of 2025 is now tempering, and volumes will likely find stability before climbing again.