To answer this question, we have compiled MOB sales over the past decade that fit one of the two criteria below:
- Monetization: investor entity acquired a health system or provider-owned building
- Buyback: health system or provider acquired an investor-owned building
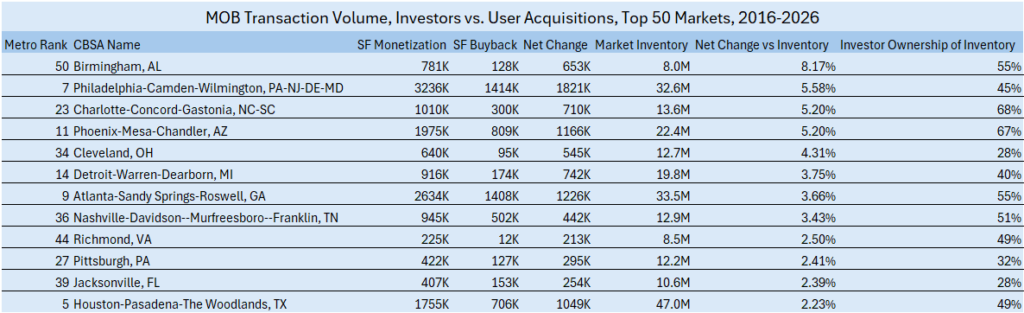
In the table below we compare these two numbers for each of the Top 50 markets and rank them by the largest shift towards investor-ownership relative to the markets size. Birmingham tops the list with a net 653K shifting towards investor-owned, equivalent to 8.17% of the MOB stock. Philadelphia, Charlotte and Phoenix are also on the high end, with between 5-6%. While we are only showing the side of the table with the highest shift towards investor-owned, about half of the markets are moving in the opposite direction.
Columbus, OH and Milwaukee, WI both have over 7% net change towards user-owners. Interestingly all the major California markets fall on this side, with buybacks outpacing monetization. There is quite a variation in overall market ownership across the top markets. The biggest disparity in the chart is between Charlotte, where 68% of the square footage is owned by investor entities, and Cleveland, where that number is only 28%. This large difference shows there is significant variation in the dynamic between real estate investors and healthcare providers depending on where you are. As private equity continues to grow its involvement in the healthcare space we will see whether markets will converge or maintain their disparity in this aspect.