• Skip to main content
  • Skip to header right navigation
  • Skip to site footer
  • Blog
  • Free Resources
RevistaMed

RevistaMed

  • About
    • Meet Revista
    • Advisory Board
    • Partners
    • Press
    • Rising Leaders Council
    • Sponsorship
    • Contact Us
  • Events
    • Annual Events
    • Subscriber Webinar
  • Why Subscribe?
    • Schedule a Demo
    • Featured Products
    • Business Development
    • Underwriting & Due Diligence
    • Asset Management
    • Capital Markets
    • Site Selection & Development
    • Leasing
  • Subscriber Login
Home / Construction/Development / 2Q2024 Snapshot

2Q2024 Snapshot

July 30, 2024 by Stephen Lindsey Topics: Construction/Development, Industry News, Transactions

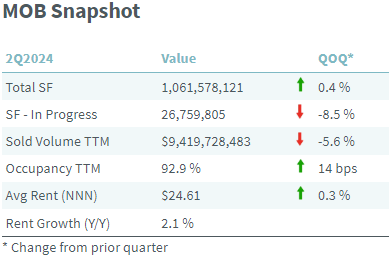
What direction has the MOB market been going in 2024? In this article we are focusing on the Top 100 metro areas. The table below shows a snapshot of the changes observed for key metrics in the second quarter of this year. Inventory continued to grow at a moderate pace, up 0.4% since the first quarter of the year. This is paired with a declining construction pipeline, which fell 8.5% to 26.8 million square feet. The number of new construction projects remains at low levels, but the number of projects delivering is relatively strong. This explains the decreasing size of the SF in progress while still maintaining sizeable inventory growth. Transaction volume stepped down 5.6% with only $9.4 billion in MOB trades over the previous 12 months.

Occupancy has consistently risen since 2021 and this quarter was no different. Up 14 basis points, and now at a level of 92.9%. Rent growth was moderate or strong, depending on which metric you look at. The increase in average triple-net rent was rather moderate with 0.3% quarter-over-quarter, or 1.2% if you annualized that rate.  The average same-store, year-over-year rent growth was 2.1%, which is solid growth historically, but lower than what we observed during peak inflation.

Stephen Lindsey

Other Articles by Stephen Lindsey:

    • Which Counties are Rapidly Increasing Healthcare Output?
    • 2026 Outpatient Development Report Recap
    • Medical Office Rent Growth Normalizes Post Inflation

Previous Post:Population Growth = More Demand for MOB Space
Next Post:MOB Rents by Region

Sidebar

Topics

  • Construction/Development
  • Industry News
  • Leasing/Property Management
  • Mergers/Acquisitions
  • Policy/Legislation
  • Real Estate Financing/Capital Markets
  • Revista Best Practices
  • Revista News
  • Sponsor Spotlight
  • Transactions
  • Uncategorized

Archives

RSS Recent Blog Posts

  • Which Counties are Rapidly Increasing Healthcare Output? April 29, 2026
    Healthcare Gross Domestic Product (HGDP) is measure of the monetary value of healthcare output. In the charts above, we are looking at growth in real HGDP for each county over the past decade. Real HGDP is inflation adjusted to provide a better view on . . . The post Which Counties are Rapidly Increasing Healthcare […]
    Stephen Lindsey
  • Which Markets Have Seen the Greatest Growth in MOB Face Rents? April 28, 2026
    The Medical Office Sector has typically averaged 2 to 3 percent year-to-year rent growth. In recent years, this level of growth has often trailed CPI inflation. As a result, investors often target medical office (or outpatient) buildings (MOBs) that have a likelihood for higher year to year rent growth. These targets will likely include markets […]
    Mike Hargrave
  • 2026 Outpatient Development Report Recap March 31, 2026
    The annual outpatient development report is now available. Produced with collaboration from HREI (Healthcare Real Estate Insights), the 2026 report covers all the outpatient construction projects that broke ground or . . . The post 2026 Outpatient Development Report Recap appeared first on RevistaMed.
    Stephen Lindsey
  • Update on Health System Medical Outpatient Building Buybacks March 27, 2026
    Health systems have been one of the most active participants in the medical properties investment sales market in the last 3 years, accounting for 17% of all sales activity as either the buyer or seller.  In 2025 alone . . . The post Update on Health System Medical Outpatient Building Buybacks appeared first on RevistaMed.
    Mindy Berman

Other Free Resources

Industry Directory

Search for and/or list your medical real estate services in Revista’s medical real estate directory.

Reports & White Papers

Download free reports & white papers on medical real estate.

Add Lease/Sale Listing

Revista provides free lease/sale listings for healthcare real estate.

Ready to Schedule a Demo?

Get in Touch Now
  • Why Subscribe?
  • Events
  • The MOB Scene
  • Add A Directory Listing
  • Add Lease/Sale Listing
  • Contact Us
  • Sponsorship
  • About
  • Data Terms of Use
  • Sponsorship Terms
  • Press

SIGN UP FOR MOB SCENE NEWSLETTER

  • This field is for validation purposes and should be left unchanged.
  • Twitter
  • Facebook
  • LinkedIn