• Skip to main content
  • Skip to header right navigation
  • Skip to site footer
  • Blog
  • Free Resources
RevistaMed

RevistaMed

  • About
    • Meet Revista
    • Advisory Board
    • Partners
    • Press
    • Rising Leaders Council
    • Sponsorship
    • Contact Us
  • Events
    • 2026 Revista Medical Real Estate Investment Forum
    • Subscriber Webinar
  • Why Subscribe?
    • Schedule a Demo
    • Revista x Pivotal
    • Featured Products
    • Business Development
    • Underwriting & Due Diligence
    • Asset Management
    • Capital Markets
    • Site Selection & Development
    • Leasing
  • Subscriber Login
Home / Construction/Development / High Demand in the Sunbelt, Phoenix Tops the List

High Demand in the Sunbelt, Phoenix Tops the List

July 27, 2023 by Hilda Martin Topics: Construction/Development, Leasing/Property Management

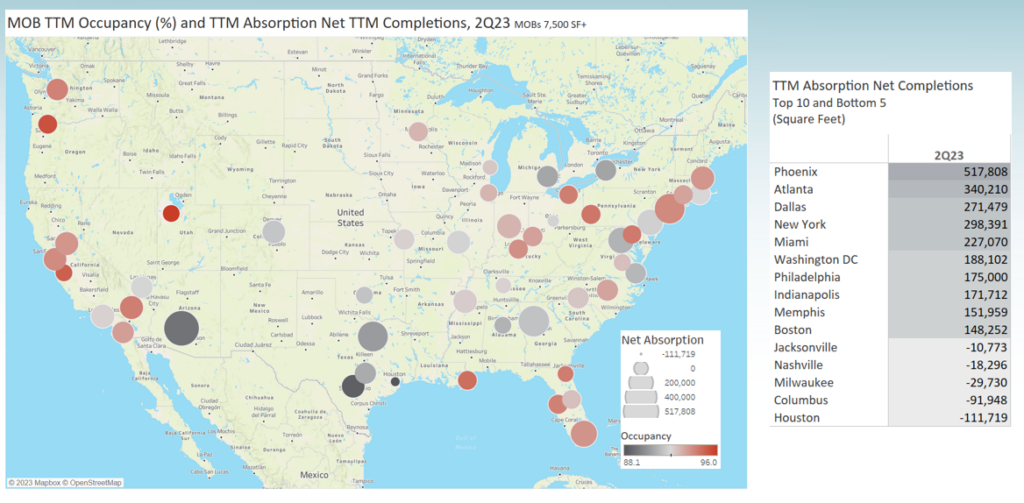
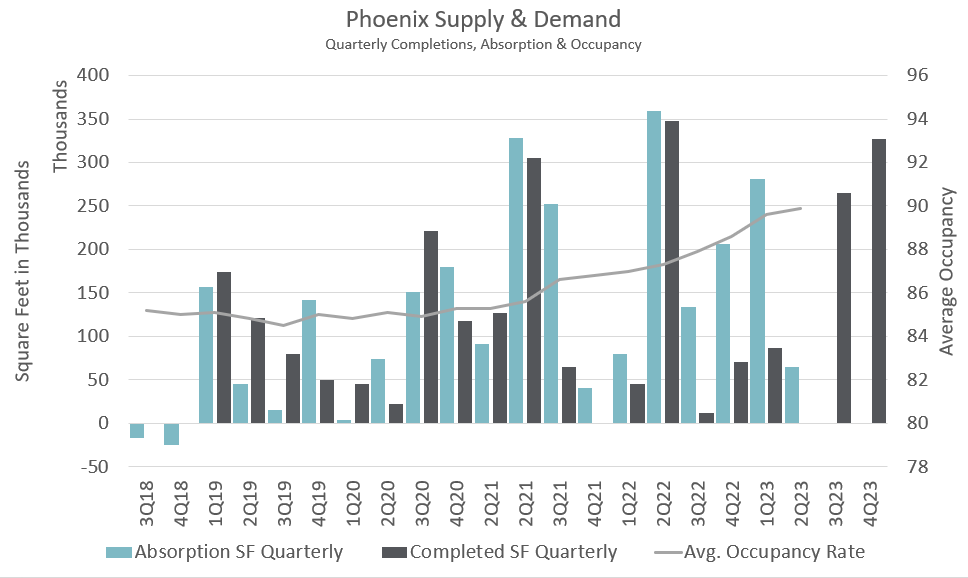
The Northeast and Pacific Coast markets have always had some of the highest occupancy rates for medical office buildings being the more expensive, high barrier-to-entry cities. However, considerable growth in demand is occurring in the sunbelt markets, and Phoenix tops the list. The metro list below and map show net absorption and occupancy for MOBs in the top 50 metro areas. (The larger the circle, the greater demand for space, color of the circle represents occupancy) Absorption reflected here is the annual change in occupied space, minus any construction deliveries during the year. This represents absorption that directly affects a change in occupancy. Phoenix tops the list with 517,808 square feet in net absorption over the past year. That demand has pushed Phoenix occupancy from 87.3% a year ago to 89.9% in the most recent quarter. See the chart below that shows quarterly absorption of space significantly outpacing the new supply coming to market. Phoenix is also one of the top markets for year-over-year, same-store rent growth, sitting at 4.9% in 2Q23. The national rent growth average is 2.8%. Want to find out more about your market? Subscribe to Revista!

Source and Copyright: Revista. Data believed to be accurate but not guaranteed and is subject to future revision. Use of this data is permitted subject to terms and conditions detailed on data.revistamed.com/terms-of-use and with proper credit to Revista or Revistamed.com.
Hilda Martin
Hilda Martin

Other Articles by Hilda Martin:

    • MOB On Campus or Community Based? Opinions Differ by Owner Type.
    • New Reports Available – Pivotal x Revista
    • Population Growth = More Demand for MOB Space

Previous Post:Transaction Activity has Slowed, but Providers are still Selling
Next Post:MOB Cap Rates Continue to Expand in 2Q23

Sidebar

Topics

  • Construction/Development
  • Industry News
  • Leasing/Property Management
  • Mergers/Acquisitions
  • Policy/Legislation
  • Real Estate Financing/Capital Markets
  • Revista Best Practices
  • Revista News
  • Sponsor Spotlight
  • Transactions
  • Uncategorized

Archives

RSS Recent Blog Posts

  • MOB Construction Update May 29, 2025
    MOB construction has been slower than usual in 2025. Less projects are breaking ground than are completing, so the pipeline has been shrinking. In recent times, inventory has typically grown around 1.5% annually. Over the past year MOB inventory has grown . . . The post MOB Construction Update appeared first on RevistaMed.
    Stephen Lindsey
  • The Return of the Portfolio Premium May 27, 2025
    The graph below displays Average MOB cap rate trends for Portfolios vs. Single Properties.  From 2017 through 2022, the Average Cap Rate for MOB Portfolios was 63 basis points lower than single MOB properties that traded. The post The Return of the Portfolio Premium appeared first on RevistaMed.
    Mike Hargrave
  • Limited Transaction Volume to Start 2025 April 29, 2025
    The preliminary 1Q25 numbers are in, and they show that transaction volume has been slow to kick off the year. $1.5 billion worth of MOBs traded in the 1st quarter, and $8.9 billion traded over the past year. This suppressed level of activity is . . . The post Limited Transaction Volume to Start 2025 […]
    Stephen Lindsey
  • A Look at 1Q25’s highest occupied Medical Office Market April 28, 2025
    That’s right!  With a 1Q25 occupancy of 96.9%, Asheville NC is the highest occupied market of the largest 125 metros RevistaMed tracks each quarter.  Asheville, which is still recovering from the effects of Hurricane Helene in September of 2024, can find strength within its healthcare market and within the MOB sector. The post A Look […]
    Mike Hargrave

Other Free Resources

Industry Directory

Search for and/or list your medical real estate services in Revista’s medical real estate directory.

Reports & White Papers

Download free reports & white papers on medical real estate.

Add Lease/Sale Listing

Revista provides free lease/sale listings for healthcare real estate.

Ready to Schedule a Demo?

Get in Touch Now
  • Why Subscribe?
  • Events
  • The MOB Scene
  • Add A Directory Listing
  • Add Lease/Sale Listing
  • Contact Us
  • Sponsorship
  • About
  • Data Terms of Use
  • Sponsorship Terms
  • Press

SIGN UP FOR MOB SCENE NEWSLETTER

  • Twitter
  • Facebook
  • LinkedIn