• Skip to main content
  • Skip to header right navigation
  • Skip to site footer
  • Blog
  • Free Resources
RevistaMed

RevistaMed

  • About
    • Meet Revista
    • Advisory Board
    • Partners
    • Press
    • Rising Leaders Council
    • Sponsorship
    • Contact Us
  • Events
    • Annual Events
    • Subscriber Webinar
  • Why Subscribe?
    • Schedule a Demo
    • Featured Products
    • Business Development
    • Underwriting & Due Diligence
    • Asset Management
    • Capital Markets
    • Site Selection & Development
    • Leasing
  • Subscriber Login
Home / Industry News / The Divergence in Base Rent Trends

The Divergence in Base Rent Trends

December 22, 2025 by Mike Hargrave Topics: Industry News, Leasing/Property Management, Real Estate Financing/Capital Markets, Revista Best Practices

The idea of a K-Shaped economy is a much talked about topic these days.  The concept is that higher earners are doing quite well while those in lower to middle income brackets are struggling with stagnant wages and higher costs.  The K-Shape can also play out with rent data where higher rents keep climbing while middle to lower tier rents are flat to even falling.  But is a K-Shape emerging with regard to MOB rent trends? 

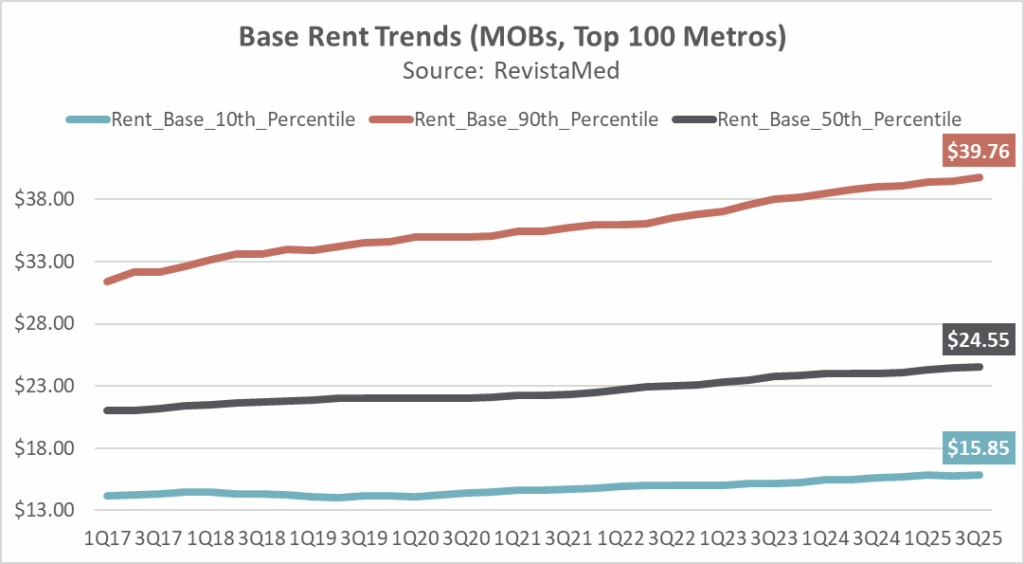
The chart below shows base rent trends for MOBs located within the nation’s 100 largest metro areas.  The rents are per square foot (on an annual basis) and are equivalent to reported face rents that are not adjusted up or down.  So, it does appear that a similar rent trend is emerging in health care real estate.  The 90th percentile base rent was $39.76 per SF in 3Q25 while the 50th percentile base rent was $24.55, and the 10th percentile base rent was $15.85.  Since 1Q18, the 90th percentile base rent has been growing by an average of 2.7% each year while the 50th percentile has been growing by an average of 1.8% and the 10th percentile has been growing by an average of 1.3%. 

So the base rent trends do resemble some of the characteristics of a K-Shaped economy.  In the last year, however, the 50th percentile base rent has been the best performer at 2.3% vs 1.9% for the 90th percentile and 1.6% for the 10th percentile. Subscribers can examine these trends for each of the top 125 metros through RevistaMed’s metro trends.

Mike Hargrave
Mike Hargrave

Other Articles by Mike Hargrave:

    • The New York Metro MOB Market is on the Upswing!
    • Which Markets Have Seen the Greatest Growth in MOB Face Rents?
    • A Quick look at the 2026 MREIF Host Metro – Los Angeles

Previous Post:Which MOB Markets have the Most Concentrated Ownership?
Next Post:Hospital Construction Pipeline Swells to 79M Square Feet

Sidebar

Topics

  • Construction/Development
  • Industry News
  • Leasing/Property Management
  • Mergers/Acquisitions
  • Policy/Legislation
  • Real Estate Financing/Capital Markets
  • Revista Best Practices
  • Revista News
  • Sponsor Spotlight
  • Transactions
  • Uncategorized

Archives

RSS Recent Blog Posts

  • Will MOB Financing Continue to Trend Upwards? June 26, 2026
    If you have been following medical office sales activity, you know that transaction volume is moving upwards. Another angle for viewing the financial environment is to look at the number of new mortgages. Looking at the mortgage trend . . . The post Will MOB Financing Continue to Trend Upwards? appeared first on RevistaMed.
    Stephen Lindsey
  • The New York Metro MOB Market is on the Upswing! June 25, 2026
    The New York (NYC) metro medical office market (MOB), which saw its occupancy rate fall as a result of the Covid-19 outbreak, is now on the rebound.  NYC’s MOB market, prior to the pandemic was extremely tight and hovered around 94%. The post The New York Metro MOB Market is on the Upswing! appeared first […]
    Mike Hargrave
  • Are Health Systems Rethinking Their Real Estate Strategy? May 29, 2026
    As health systems face growing pressure to optimize capital and accelerate growth, many are turning to third-party developers and property owners to support their real estate needs. Using Revista’s inventory of medical outpatient buildings (MOB) larger than 7,500 square feet, we examined which health systems are . . . The post Are Health Systems Rethinking […]
    Taryn Harris
  • More MOB Sales in 2026 May 29, 2026
    $16.3 billion in MOBs have traded over the past 12 months. That is the highest level of volume we have recorded since 2Q23. These sales comprised 47 million square feet in MOB buildings, equivalent to 2.9% of . . . The post More MOB Sales in 2026 appeared first on RevistaMed.
    Stephen Lindsey

Other Free Resources

Industry Directory

Search for and/or list your medical real estate services in Revista’s medical real estate directory.

Reports & White Papers

Download free reports & white papers on medical real estate.

Add Lease/Sale Listing

Revista provides free lease/sale listings for healthcare real estate.

Ready to Schedule a Demo?

Get in Touch Now
  • Why Subscribe?
  • Events
  • The MOB Scene
  • Add A Directory Listing
  • Add Lease/Sale Listing
  • Contact Us
  • Sponsorship
  • About
  • Data Terms of Use
  • Sponsorship Terms
  • Press

SIGN UP FOR MOB SCENE NEWSLETTER

  • This field is for validation purposes and should be left unchanged.
  • Twitter
  • Facebook
  • LinkedIn