Fundamentals remain strong in the outpatient sector, with occupancy rates hovering around a cyclical high of 92.5%. Since 2018, medical office building (MOB) occupancy rates have remained in the range of 91.5% – 92.5%. Moderately lower growth in the supply of outpatient real estate, combined with healthcare demand that ever marches forward, is keeping upward pressure on occupancy.
Occupancy is typically consistent, but what is the state of rent inflation within the outpatient sector? Revista’s recently released 4Q25 data shows a year-over-year growth rate of 1.9% (asking rents). The chart below shows what rent growth trend for the past nine years, with inflation (CPI) overlaid. The volatility of rent growth is not as high as CPI, so the scales have been adjusted to better display the relationship. Rent growth generally mirrors inflation, however it lagged the rapid changes that started in 2021.
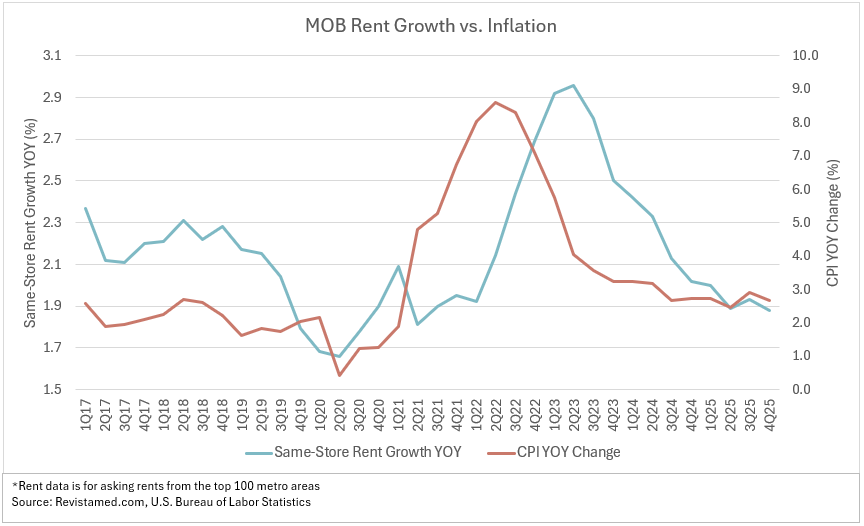
Peak inflation was reached in 2Q22, with an average CPI of 8.6%. MOB rent growth didn’t peak until one year later at 3% in 2Q23. During that period of peak inflation, Revista conducted a survey of leasing brokers and found that new leases often used 3% annual rent escalations instead of the previous norm of 2%. Inflation clearly influences rents, through both operating and construction costs. New builds have shown increasingly high asking rents, due to cost of construction. Some recent indicators are providing evidence that construction costs are no longer growing, but they remain at an elevated level.
Since 2023, the wave of inflation has passed, and while overall inflation remains slightly elevated, rent growth has come back down to historical norms. Keep in mind that we are looking at a bird’s eye view here. While in the aggregate there is a clear pattern, many individual markets aren’t neatly following the national inflation trend and a running significantly higher or lower than the average.
Are you Interested in a data platform tailored to healthcare real estate? Schedule a Demo