• Skip to main content
  • Skip to header right navigation
  • Skip to site footer
  • Blog
  • Free Resources
RevistaMed

RevistaMed

  • About
    • Meet Revista
    • Advisory Board
    • Partners
    • Press
    • Rising Leaders Council
    • Sponsorship
    • Contact Us
  • Events
    • 2025 Revista Medical Real Estate Investment Forum
    • Subscriber Webinar
  • Why Subscribe?
    • Revista x Pivotal
    • Featured Products
    • Business Development
    • Underwriting & Due Diligence
    • Asset Management
    • Capital Markets
    • Site Selection & Development
    • Leasing
  • Subscriber Login
Home / Leasing/Property Management / Off Campus MOBs Catching up to On Campus MOBs in the Top 50 Metros

Off Campus MOBs Catching up to On Campus MOBs in the Top 50 Metros

November 20, 2024 by Mike Hargrave Topics: Industry News, Leasing/Property Management, Revista News

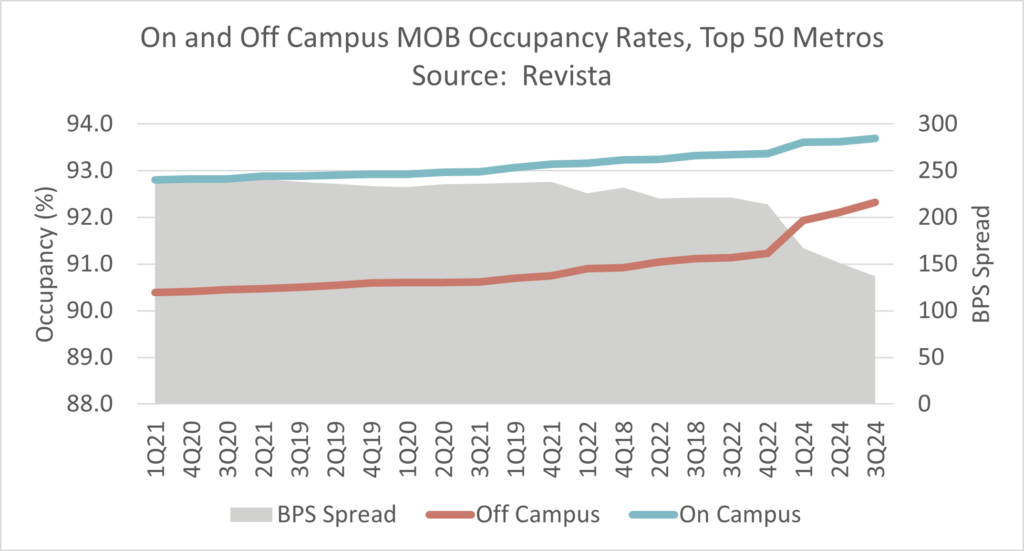
Did you know that Revista tracks both On and Off Campus medical office buildings (MOBs)?  And starting in 2025 we will also track adjacent to campus MOBs.  On and Off Campus MOBs have different operating characteristics particularly regarding ground leases and potential tenant or use restrictions.  They have different investment profiles too and on campus MOBs have higher valuations than off campus MOBs.  One reason why is the difference between their respective occupancy rates.  Historically, on campus MOBs have run higher occupancy rates compared to off campus MOBs.  The graph below shows an occupancy rate trend in the top 50 metros for both on and off campus MOBs.  Traditionally, off campus MOBs have run occupancy rates some 200+ basis points lower than on campus MOBs.  But there are signs that this is beginning to change in recent quarters.  The spread between the 2 occupancy rate trends is now 137 basis points (3Q24) and has been declining at a faster rate for the past year+.  Why is this happening?  One reason could be that on campus MOBs are near their natural occupancy high (currently at 93.7%) and that off campus MOBs have a bit more room to run up (current occupancy is 92.3%).  Will this continue?  Tune into Revista or download the trends yourself from either the metro reports pages or the rankings pages which are available to subscribers.  Schedule a discovery call today by contacting Hilda Martin (hilda@revistacompanies.com)

Mike Hargrave
Mike Hargrave

Other Articles by Mike Hargrave:

    • A Look at 1Q25’s highest occupied Medical Office Market
    • Outpatient Real Estate Sector Riding a Wave of Strength!
    • Private Investors Net Buyers, REITs Net Sellers in 2024!

Previous Post:Private Investors Net Buyers, REITs Net Sellers in 2024!
Next Post:Health System Transaction Activity: Monetization vs Buybacks

Sidebar

Topics

  • Construction/Development
  • Industry News
  • Leasing/Property Management
  • Mergers/Acquisitions
  • Policy/Legislation
  • Real Estate Financing/Capital Markets
  • Revista Best Practices
  • Revista News
  • Sponsor Spotlight
  • Transactions
  • Uncategorized

Archives

RSS Recent Blog Posts

  • Limited Transaction Volume to Start 2025 April 29, 2025
    The preliminary 1Q25 numbers are in, and they show that transaction volume has been slow to kick off the year. $1.5 billion worth of MOBs traded in the 1st quarter, and $8.9 billion traded over the past year. This suppressed level of activity is . . . The post Limited Transaction Volume to Start 2025 […]
    Stephen Lindsey
  • A Look at 1Q25’s highest occupied Medical Office Market April 28, 2025
    That’s right!  With a 1Q25 occupancy of 96.9%, Asheville NC is the highest occupied market of the largest 125 metros RevistaMed tracks each quarter.  Asheville, which is still recovering from the effects of Hurricane Helene in September of 2024, can find strength within its healthcare market and within the MOB sector. The post A Look […]
    Mike Hargrave
  • Rising Rents for Newly Built MOBs March 31, 2025
    How have rising construction costs affected rents? Revista’s construction data continues to show increases in the cost of building an MOB. The average cost per square foot came in at $549 for completed MOBs in 2024. That is a . . . The post Rising Rents for Newly Built MOBs appeared first on RevistaMed.
    Stephen Lindsey
  • Cap Rates by Property Price February 28, 2025
    Typically, the transaction stats we look at are only for MOB trades that are at least $2.5 million. However, we do have data on a solid portion of the smaller deals. In the chart below we compare cap rates based on the property price, including those under $2.5M . . . The post Cap Rates […]
    Stephen Lindsey

Other Free Resources

Industry Directory

Search for and/or list your medical real estate services in Revista’s medical real estate directory.

Reports & White Papers

Download free reports & white papers on medical real estate.

Add Lease/Sale Listing

Revista provides free lease/sale listings for healthcare real estate.

Ready to Schedule a Demo?

Get in Touch Now
  • Why Subscribe?
  • Events
  • The MOB Scene
  • Add A Directory Listing
  • Add Lease/Sale Listing
  • Contact Us
  • Sponsorship
  • About
  • Data Terms of Use
  • Sponsorship Terms
  • Press

SIGN UP FOR MOB SCENE NEWSLETTER

  • Twitter
  • Facebook
  • LinkedIn