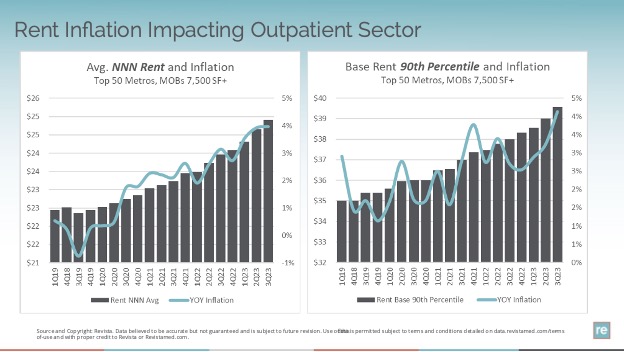
Revista recently held its 3Q23 Subscriber Webinar. One of the topics discussed was rent inflation. The charts below show Avg. NNN and Avg. 90th percentile base rents for medical office or outpatient buildings within the top 50 metros. Each graph is overlayed with the annual growth in that respective rent trend. Note that this measure of rent inflation is different than our same-store rent growth metric which we also publish. On rent inflation, it is clear rents are rising across the top 50 metro areas. The Avg NNN rent is currently $24.91 and that is up almost $1/SF in the past year. The 90th percentile rent is at $39.57 and is up more than $1.50/SF in the past year.
Troy Freeman, Vice President, Real Estate Management, Banner Health and a member of Revista’s advisory board commented that rising rents (paraphrasing) are impacting project decisions from a go – no go decision.
This may be one reason why construction starts are down across the sector. Preliminary data for 3Q23 shows 12.9 million square feet (MSF) of outpatient space started (TTM basis). This figure is down from 23.6 MSF started in 3Q22.


