• Skip to main content
  • Skip to header right navigation
  • Skip to site footer
  • Blog
  • Free Resources
RevistaMed

RevistaMed

  • About
    • Meet Revista
    • Advisory Board
    • Partners
    • Press
    • Rising Leaders Council
    • Sponsorship
    • Contact Us
  • Events
    • 2025 Revista Medical Real Estate Investment Forum
    • Subscriber Webinar
  • Why Subscribe?
    • Revista x Pivotal
    • Featured Products
    • Business Development
    • Underwriting & Due Diligence
    • Asset Management
    • Capital Markets
    • Site Selection & Development
    • Leasing
  • Subscriber Login
Home / Real Estate Financing/Capital Markets / TTM MOB Cap Rate Trends Showing a 20-30 Basis Points (bps) Sequential Rise

TTM MOB Cap Rate Trends Showing a 20-30 Basis Points (bps) Sequential Rise

April 26, 2023 by Mike Hargrave Topics: Industry News, Real Estate Financing/Capital Markets

Revista recently held its 1Q23 Subscriber Webcast.  Hilda Martin and Mike Hargrave of Revista were joined by Gino Lollio, an Executive Director with Cushman & Wakefield Healthcare Capital Markets.  Over 230 subscriber lines registered for the webcast indicating a high level of interest in emerging trends we covered. 

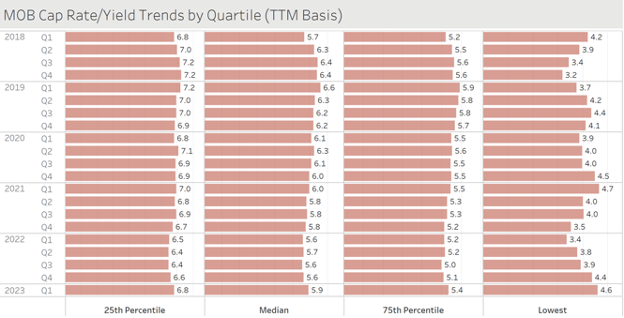
One of the key themes covered was “what were current cap rates within the sector”? To address this question, we pulled up Revista’s somewhat famous MOB Cap Rate/Yield Trends by Quartile chart (figure 1).  The chart displays MOB cap rate trends for the US for the 25th percentile (higher cap rates), the median, 75th percentile and the lowest cap rate.  When looking at these cap rates each percentile is trending upwards.  The 25th percentile is up 20 bps from 4Q22 and 40 bps from its low of 6.4 in 3Q22.  The median and 75th percentile are both up 30 bps sequentially.  The 75th percentile had been holding on as it generally represents many of the “institutional” MOB trades occurring within the sector.  Commenting on the trends, Mr. Lollio said while these cap rates might be moving up, they are not moving up as much as you might see in other CRE sectors (paraphrasing). It will be interesting to see the direction of cap rates in 2023 and Revista will make sure to track it!

Figure 1 (source:  Revistamed)

Mike Hargrave
Mike Hargrave

Other Articles by Mike Hargrave:

    • A Look at 1Q25’s highest occupied Medical Office Market
    • Outpatient Real Estate Sector Riding a Wave of Strength!
    • Off Campus MOBs Catching up to On Campus MOBs in the Top 50 Metros

Previous Post:2022 Top Outpatient Developers – Developer Owned Projects
Next Post:Regulation D – The 0% Reserve Requirement 

Sidebar

Topics

  • Construction/Development
  • Industry News
  • Leasing/Property Management
  • Mergers/Acquisitions
  • Policy/Legislation
  • Real Estate Financing/Capital Markets
  • Revista Best Practices
  • Revista News
  • Sponsor Spotlight
  • Transactions
  • Uncategorized

Archives

RSS Recent Blog Posts

  • Limited Transaction Volume to Start 2025 April 29, 2025
    The preliminary 1Q25 numbers are in, and they show that transaction volume has been slow to kick off the year. $1.5 billion worth of MOBs traded in the 1st quarter, and $8.9 billion traded over the past year. This suppressed level of activity is . . . The post Limited Transaction Volume to Start 2025 […]
    Stephen Lindsey
  • A Look at 1Q25’s highest occupied Medical Office Market April 28, 2025
    That’s right!  With a 1Q25 occupancy of 96.9%, Asheville NC is the highest occupied market of the largest 125 metros RevistaMed tracks each quarter.  Asheville, which is still recovering from the effects of Hurricane Helene in September of 2024, can find strength within its healthcare market and within the MOB sector. The post A Look […]
    Mike Hargrave
  • Rising Rents for Newly Built MOBs March 31, 2025
    How have rising construction costs affected rents? Revista’s construction data continues to show increases in the cost of building an MOB. The average cost per square foot came in at $549 for completed MOBs in 2024. That is a . . . The post Rising Rents for Newly Built MOBs appeared first on RevistaMed.
    Stephen Lindsey
  • Cap Rates by Property Price February 28, 2025
    Typically, the transaction stats we look at are only for MOB trades that are at least $2.5 million. However, we do have data on a solid portion of the smaller deals. In the chart below we compare cap rates based on the property price, including those under $2.5M . . . The post Cap Rates […]
    Stephen Lindsey

Other Free Resources

Industry Directory

Search for and/or list your medical real estate services in Revista’s medical real estate directory.

Reports & White Papers

Download free reports & white papers on medical real estate.

Add Lease/Sale Listing

Revista provides free lease/sale listings for healthcare real estate.

Ready to Schedule a Demo?

Get in Touch Now
  • Why Subscribe?
  • Events
  • The MOB Scene
  • Add A Directory Listing
  • Add Lease/Sale Listing
  • Contact Us
  • Sponsorship
  • About
  • Data Terms of Use
  • Sponsorship Terms
  • Press

SIGN UP FOR MOB SCENE NEWSLETTER

  • Twitter
  • Facebook
  • LinkedIn