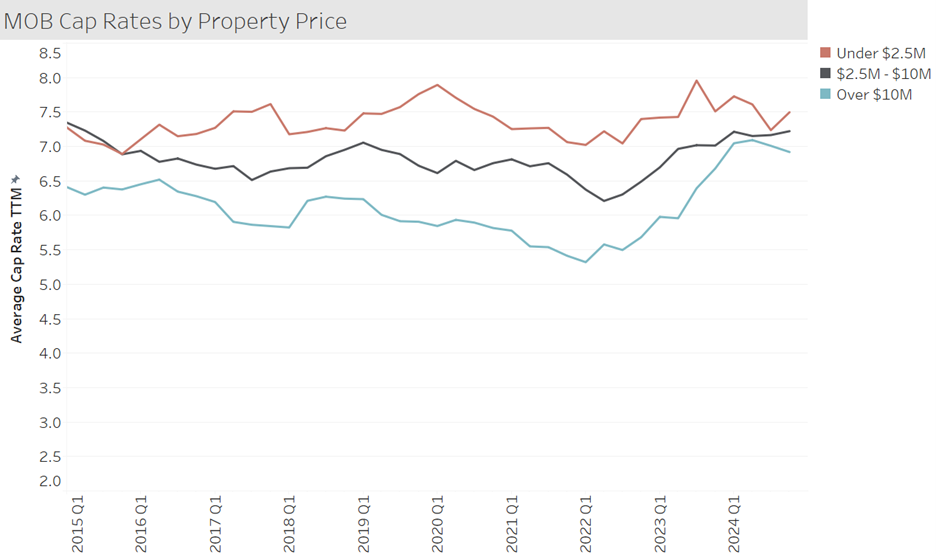
Typically, the transaction stats we look at are only for MOB trades that are at least $2.5 million. However, we do have data on a solid portion of the smaller deals. In the chart below we compare cap rates based on the property price, including those under $2.5M sales. The hierarchy is as expected. The Under $2.5M category runs around 50 bps higher than the middle group and the Over $10M is around 70 bps lower than the middle group. Over the past two years there has been a convergence, mainly as the result of the expansion from the Over $10M group. If we focus on the past 3 years, the range between the low and peak is largest for the Over $10M group, at 180 basis points. While not shown here, this pattern is not shared when looking at pricing from a price per square foot angle. The average price per square foot for the Over $10M group is typically around $170 higher than the Under $2.5M group, and unlike what we see in cap rates, that gap has been maintained in 2024.