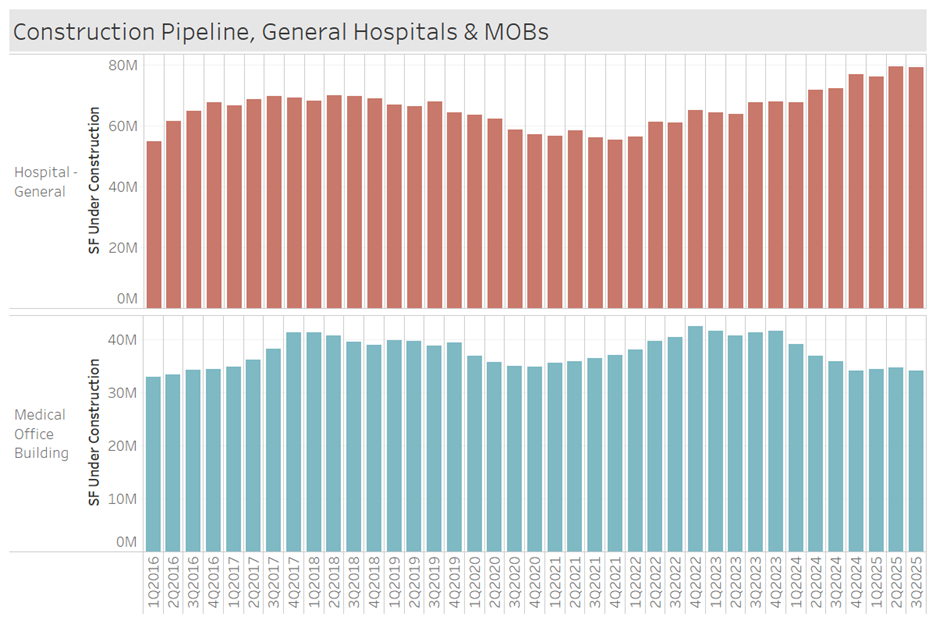
The amount of hospital space under construction is continuing a multi-year climb, now at a level of 79 million square feet. With an estimated value of $93 billion, the pipeline is significantly higher than the norm over the past decade. The last peak was in 2018, totaling 70 million square feet, worth an estimated $50 billion. Cost inflation is clearly adding to the current pipeline value, with the median cost per bed reaching nearly $2 million for hospitals that completed in 2025. Roughly half of the pipeline is made up of expansions on existing hospitals, and the other half is made up of new developments and replacements.
Construction activity on the inpatient and outpatient sides don’t always move in parallel and we can see this when we look at the outpatient trend. In 2024, the pipeline decreased and has been flat throughout 2025. As of 3Q25, there is 34 million square feet in progress for an estimated value of $24 billion. While not visible in this chart, MOB groundbreakings have picked up in the back half of 2025, and 1Q25 was the bottom point in activity. A typical trough in the MOB pipeline is 33-34 million square feet, which lines up with the levels seen in 2025.