• Skip to main content
  • Skip to header right navigation
  • Skip to site footer
  • Blog
  • Free Resources
RevistaMed

RevistaMed

  • About
    • Meet Revista
    • Advisory Board
    • Partners
    • Press
    • Rising Leaders Council
    • Sponsorship
    • Contact Us
  • Events
    • Annual Events
    • Subscriber Webinar
  • Why Subscribe?
    • Schedule a Demo
    • Featured Products
    • Business Development
    • Underwriting & Due Diligence
    • Asset Management
    • Capital Markets
    • Site Selection & Development
    • Leasing
  • Subscriber Login
Home / Uncategorized / The Fed Sets the Stage for Higher Fed Funds Rate in 2022

The Fed Sets the Stage for Higher Fed Funds Rate in 2022

December 16, 2021 by Mike Hargrave Topics: Uncategorized

The Federal Reserve (Fed) yesterday released updated economic projections including their expectations for the Fed Funds rate.  To look at the potential impact on MOB cap rates, let’s review recent history.   

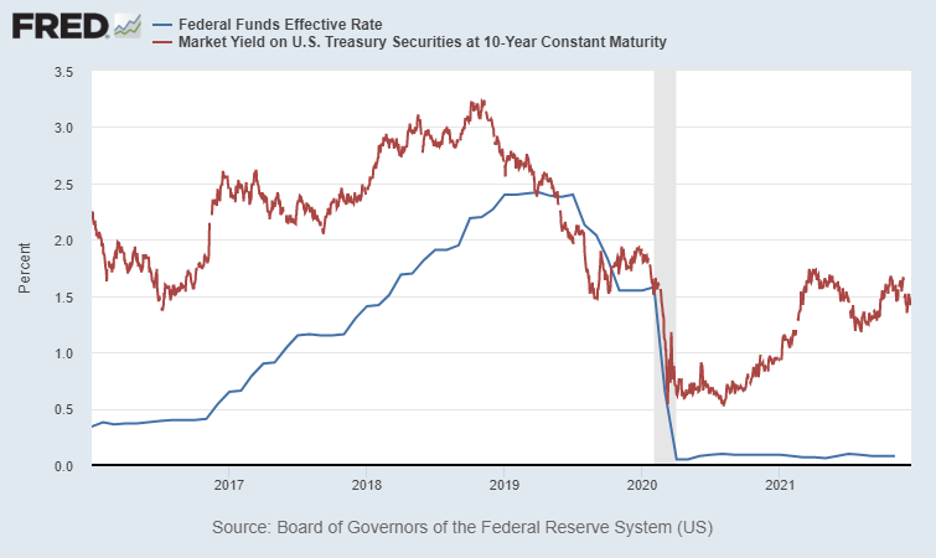
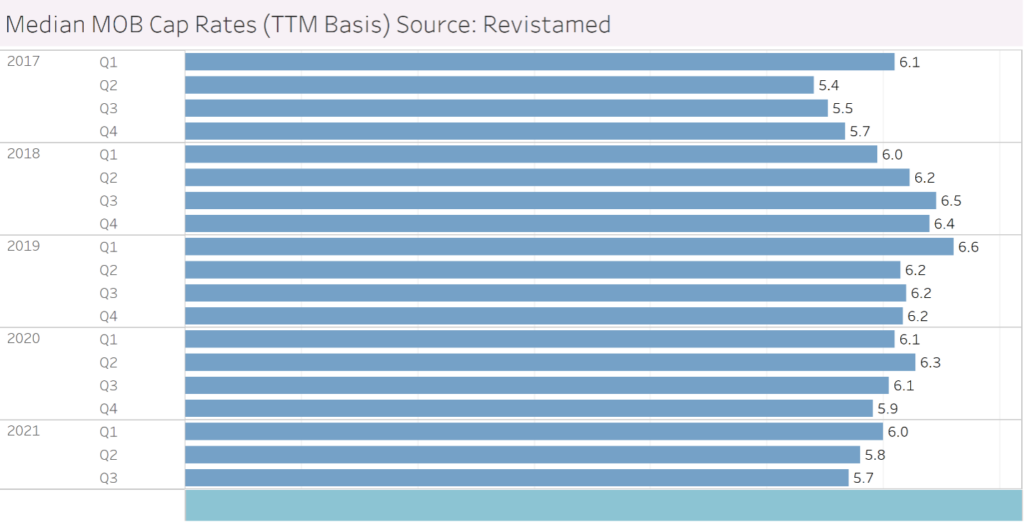
The current Fed Funds rate is .08% (rounds to .1%).  This rate has been hovering at this level for about 18 months or so since the onset of the Covid-19 pandemic.  Prior to that the Fed Funds rate was falling from 2.4% to around 1.5% during the middle of 2019 to just prior to the pandemic. From the 2018 to 2019 period the Fed Funds rate was slightly rising from 1.4% to 2.4%.  At the same time, the 10 year Treasury yield was rising eventually establishing a high of 3.2% during November of 2018.  What happened to MOB cap rates during this period?  Well the median MOB cap rate rose from 6.0% in 1Q18 to 6.6% on 1Q19.  The did start coming back down in 2019 to 6.2% while the Fed funds rate and Treasury rate were also falling. 

The updated Fed economic projections are posted below.  Generally they expect higher levels of inflation moving forward compared to earlier thinking in September.  As a result, they now expect up to 3 interest rate hikes in 2022.  In addition, they are going put an end to asset purchases as bit earlier than previously announced.   

All things considered; a rising Fed Funds rate could lead the 10 year Treasury yield higher.  We will see if that happens, and if it does, what happens to MOB cap rates 

Economic projections of Federal Reserve Board members and Federal Reserve Bank presidents, under their individual assumptions of projected appropriate monetary policy, December 2021 

 2021 2022 2023 
Change in Real GDP 5.5 4.0 2.2 
   September Projection 5.9 3.8 2.5 
Unemployment Rate 4.3 3.5 3.5 
   September Projection 4.8 3.8 3.5 
PCE Inflation 5.3 2.6 2.3 
   September Projection 4.2 2.2 2.2 
Core PCE Inflation 4.4 2.7 2.1 
   September Projection 3.7 2.3 2.1 
Fed Funds Rate 0.1 0.9 1.6 
   September Projection 0.1 0.3 1.0 
Mike Hargrave
Mike Hargrave

Other Articles by Mike Hargrave:

    • Which Markets Have Seen the Greatest Growth in MOB Face Rents?
    • A Quick look at the 2026 MREIF Host Metro – Los Angeles
    • The Divergence in Base Rent Trends

Previous Post:Top Ten Metros for MOB Sales Activity
Next Post:2021 was both the ‘Year of the Portfolio’ and the ‘Year of the Recapitalization’

Sidebar

Topics

  • Construction/Development
  • Industry News
  • Leasing/Property Management
  • Mergers/Acquisitions
  • Policy/Legislation
  • Real Estate Financing/Capital Markets
  • Revista Best Practices
  • Revista News
  • Sponsor Spotlight
  • Transactions
  • Uncategorized

Archives

RSS Recent Blog Posts

  • Are Health Systems Rethinking Their Real Estate Strategy? May 29, 2026
    As health systems face growing pressure to optimize capital and accelerate growth, many are turning to third-party developers and property owners to support their real estate needs. Using Revista’s inventory of medical outpatient buildings (MOB) larger than 7,500 square feet, we examined which health systems are . . . The post Are Health Systems Rethinking […]
    Taryn Harris
  • More MOB Sales in 2026 May 29, 2026
    $16.3 billion in MOBs have traded over the past 12 months. That is the highest level of volume we have recorded since 2Q23. These sales comprised 47 million square feet in MOB buildings, equivalent to 2.9% of . . . The post More MOB Sales in 2026 appeared first on RevistaMed.
    Stephen Lindsey
  • Which Counties are Rapidly Increasing Healthcare Output? April 29, 2026
    Healthcare Gross Domestic Product (HGDP) is measure of the monetary value of healthcare output. In the charts above, we are looking at growth in real HGDP for each county over the past decade. Real HGDP is inflation adjusted to provide a better view on . . . The post Which Counties are Rapidly Increasing Healthcare […]
    Stephen Lindsey
  • Which Markets Have Seen the Greatest Growth in MOB Face Rents? April 28, 2026
    The Medical Office Sector has typically averaged 2 to 3 percent year-to-year rent growth. In recent years, this level of growth has often trailed CPI inflation. As a result, investors often target medical office (or outpatient) buildings (MOBs) that have a likelihood for higher year to year rent growth. These targets will likely include markets […]
    Mike Hargrave

Other Free Resources

Industry Directory

Search for and/or list your medical real estate services in Revista’s medical real estate directory.

Reports & White Papers

Download free reports & white papers on medical real estate.

Add Lease/Sale Listing

Revista provides free lease/sale listings for healthcare real estate.

Ready to Schedule a Demo?

Get in Touch Now
  • Why Subscribe?
  • Events
  • The MOB Scene
  • Add A Directory Listing
  • Add Lease/Sale Listing
  • Contact Us
  • Sponsorship
  • About
  • Data Terms of Use
  • Sponsorship Terms
  • Press

SIGN UP FOR MOB SCENE NEWSLETTER

  • This field is for validation purposes and should be left unchanged.
  • Twitter
  • Facebook
  • LinkedIn