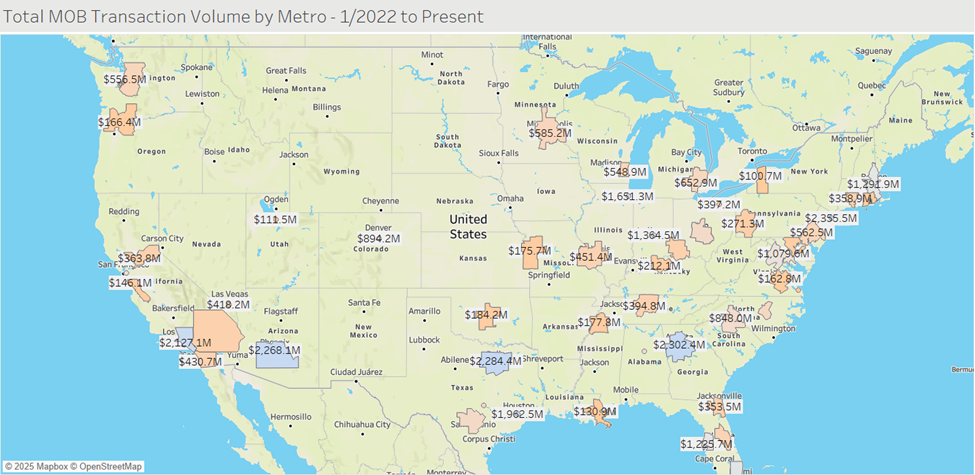
RevistaMed tracks medical office (or medical outpatient) building transaction activity across the US and has a time series back to 2013. During that time, Revista has tracked over $170 Billion of MOB transaction activity. But what about during the past 5 years? Where have investors been actively buying? The MAP below shows the top 50 metros and their MOB transaction volume from 1Q22 to 3Q25. During this time, New York City, Atlanta, Dallas, Phoenix and Los Angeles have been the most active metros. Each of these metros has seen over $2B of MOB transaction activity from 1Q22 to 3Q25. So let’s briefly look at these metros:
New York ($2.4B of MOB Transaction Activity from 1Q22 to 3Q25) – New York makes sense as it is the largest metro (77.4 MSF of MOB space) so it should produce the most transaction activity. The Investor/Private group dominates the buying in the New York Metro (59% of the buying activity) while hospitals and health systems have also been active buyers (22%).
Atlanta ($2.3B) – the Health Systems in Atlanta are very competitive and have historically partnered with investors to grow their market share through MOB construction. This has enabled a high level of transaction activity in the market. Investors have grabbed 58% of the buying activity while REITs have claimed 31% of the activity.
Dallas ($2.3B) – Dallas is like Atlanta regarding Health Systems partnering with investors and REIT on their outpatient strategies. Hospitals and Health systems have claimed just 8% of the buying activity in Dallas since 1Q22. Private Investors have gained the largest share at 63% while REITs have claimed 25% of the buying activity since 1Q22.
Phoenix ($2.3B) – Private Investors (56%) and REITs (40%) have dominated the MOB buying in the Phoenix market since 1Q22. The Phoenix market has also grown significantly since 1Q22, which has led to investment opportunities for these groups.
Los Angeles ($2.1B) – the Los Angeles MOB market is mostly owned and traded by Private Investors. They have claimed 69% of the MOB buying activity since 1Q22. Hospitals and Health Systems have claimed 19% of the activity while Providers and REITs each have less than 10% of the buying activity.