• Skip to main content
  • Skip to header right navigation
  • Skip to site footer
  • Blog
  • Free Resources
RevistaMed

RevistaMed

  • About
    • Meet Revista
    • Advisory Board
    • Partners
    • Press
    • Rising Leaders Council
    • Sponsorship
    • Contact Us
  • Events
    • 2026 Revista Medical Real Estate Investment Forum
    • Subscriber Webinar
  • Why Subscribe?
    • Schedule a Demo
    • Featured Products
    • Business Development
    • Underwriting & Due Diligence
    • Asset Management
    • Capital Markets
    • Site Selection & Development
    • Leasing
  • Subscriber Login
Home / Industry News / The Medical Office Sector and GDP Growth

The Medical Office Sector and GDP Growth

July 28, 2022 by Stephen Lindsey Topics: Industry News, Mergers/Acquisitions, Real Estate Financing/Capital Markets, Transactions

This morning the BEA released its first official estimate of real GDP growth for 2Q22. It came in at -0.9. The revised official rate from last quarter was -1.6, and depending on the definition used, some would now say that we are in a recession. Regardless of whether we are technically in a recession, investors need to stay alert within this economic environment. If the Covid recession does in fact have a sequel, what can we expect out of the MOB sector? Every economic cycle is unique and the environment of the initial Covid recession was characterized by lockdowns and high unemployment, which is different from current conditions. However, it is still useful to look at how MOB fundamentals have held up over the past few years.

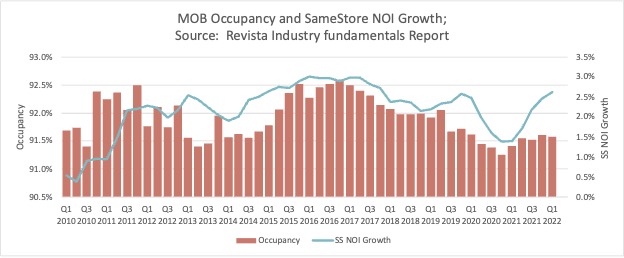
If we look at the quarterly occupancy (first graph) during 2020, we can see it dipped about 40 basis points in comparison to the end of 2019. This goes side-by-side with a decrease in the growth of net operating income (NOI) of about 1%. Since 2010, the aggregated industry ranges have been:

  • Occupancy: (91.3% – 92.6%)
  • NOI Growth: (0.4% – 3.0%)

The stable long-term trends can provide comfort to investors, as the sector has proved resilient over long cycles and through economic downturns. Recently, both metrics have been trending back up, and hopefully these give a clearer picture of what are the possibilities going forward.

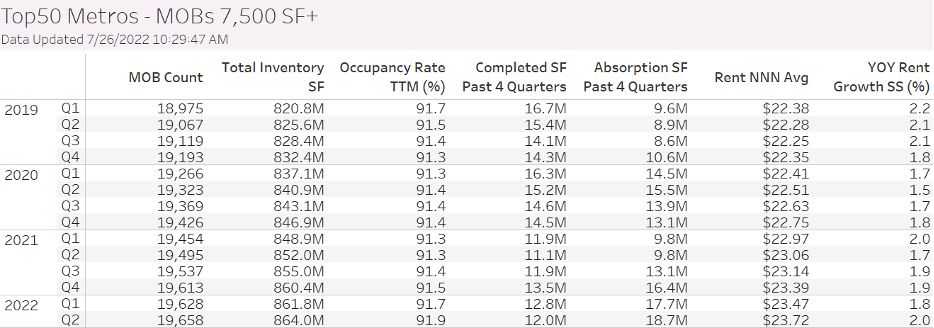
 If it we look at some other fundamentals in the shorter term, we can see that rent growth did have a low that corresponded to the peak of the recession, but it has slowly gravitated back towards 2019 levels. We saw completed projects slow down due to uncertainty, delays, and rising costs. Absorption has been rather volatile, but it is now stronger than ever. No one can predict exactly how the economic situation will unfold, but the MOB sector has not given us a reason to be worried. We will continue to keep an eye out, and if you want the most in-depth view of our numbers, be sure to check out our 2Q22 subscriber webcast from last week. 

Stephen Lindsey

Other Articles by Stephen Lindsey:

    • Which MOB Markets have the Most Concentrated Ownership?
    • Sales Activity Across Different Types of Healthcare Real Estate
    • Fundamentals in Fast Growing Core Markets

Previous Post:Annual MOB Transaction Volume Over $21B
Next Post:San Jose & Las Vegas Top Markets for MOB Rent Growth

Sidebar

Topics

  • Construction/Development
  • Industry News
  • Leasing/Property Management
  • Mergers/Acquisitions
  • Policy/Legislation
  • Real Estate Financing/Capital Markets
  • Revista Best Practices
  • Revista News
  • Sponsor Spotlight
  • Transactions
  • Uncategorized

Archives

RSS Recent Blog Posts

  • Which MOB Markets have the Most Concentrated Ownership? November 21, 2025
    To answer this, we analyzed how MOB square footage is spread across all the owners in each of the top 125 markets. The chart below lists the most concentrated markets, with . . . The post Which MOB Markets have the Most Concentrated Ownership? appeared first on RevistaMed.
    Stephen Lindsey
  • Here Are the Most Active Metros for MOB Transactions November 20, 2025
    RevistaMed tracks medical office (or medical outpatient) building transaction activity across the US and has a time series back to 2013. The post Here Are the Most Active Metros for MOB Transactions appeared first on RevistaMed.
    Mike Hargrave
  • Sales Activity Across Different Types of Healthcare Real Estate October 31, 2025
    Medical real estate seems to be in a tide shift when it comes to sales activity. With a second 25-bps cut in the federal funds rate and the announcement of the Remedy/Welltower transaction, we already know 4Q . . . The post Sales Activity Across Different Types of Healthcare Real Estate appeared first on RevistaMed.
    Stephen Lindsey
  • MOB Occupancy Rate Hovering at Cyclical High  October 30, 2025
    The Medical Outpatient Building or Medical Office Building sector (both MOB) is at a cyclical high in 3Q25. The post MOB Occupancy Rate Hovering at Cyclical High  appeared first on RevistaMed.
    Mike Hargrave

Other Free Resources

Industry Directory

Search for and/or list your medical real estate services in Revista’s medical real estate directory.

Reports & White Papers

Download free reports & white papers on medical real estate.

Add Lease/Sale Listing

Revista provides free lease/sale listings for healthcare real estate.

Ready to Schedule a Demo?

Get in Touch Now
  • Why Subscribe?
  • Events
  • The MOB Scene
  • Add A Directory Listing
  • Add Lease/Sale Listing
  • Contact Us
  • Sponsorship
  • About
  • Data Terms of Use
  • Sponsorship Terms
  • Press

SIGN UP FOR MOB SCENE NEWSLETTER

  • Twitter
  • Facebook
  • LinkedIn