• Skip to main content
  • Skip to header right navigation
  • Skip to site footer
  • Blog
  • Free Resources
RevistaMed

RevistaMed

  • About
    • Meet Revista
    • Advisory Board
    • Partners
    • Press
    • Rising Leaders Council
    • Sponsorship
    • Contact Us
  • Events
    • 2026 Revista Medical Real Estate Investment Forum
    • Subscriber Webinar
  • Why Subscribe?
    • Schedule a Demo
    • Featured Products
    • Business Development
    • Underwriting & Due Diligence
    • Asset Management
    • Capital Markets
    • Site Selection & Development
    • Leasing
  • Subscriber Login
Home / Industry News / Physician Office Employment Now Fully Recovered

Physician Office Employment Now Fully Recovered

January 27, 2022 by Mike Hargrave Topics: Industry News, Leasing/Property Management

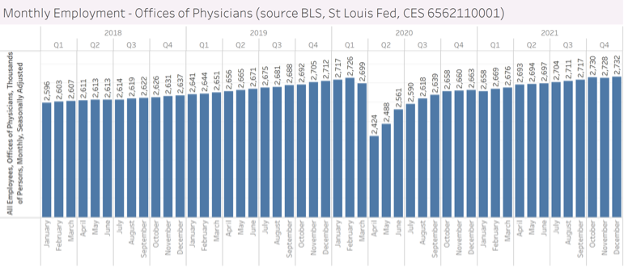
In what is a remarkable recovery compared to other sectors, physician office employment is now fully recovered from its losses experienced during the Covid-19 Pandemic.  We are showing a graph below that displays monthly employment within offices of physicians in the US.  The Bureau of Labor Statistics (BLS) collects and maintains this data and we are grabbing it from the St Louis Federal Reserve.  

If the graph were stretched back in time you would see that physician office employment grows 2-3 percent annually even during economic downturns like the great recession.  But that changed during the Covid-19 Pandemic.  The graph below shows that employment peaked in February 2020 with 2.726 million employees (according to their survey).  This figure fell to 2.424 million employees in April 2020. This was a drop of 11%.  

But physician offices were some of the first businesses to open back up after the nationwide lockdowns experienced in 2020.  By December of 2020 the number of employed in the sector was within 97% of the April highs.  Its been a slow but consistent recovery since the end of 2020 and we finally climbed ahead of the February 2020 highs in November 2021.  

Even though the recovery looks smooth at the national level, it is uneven across states.  States like Maryland, Florida and New Jersey are all 5%+ ahead of February 2020 highs while states like New York, Massachusetts and Colorado are still 2%+ below the February 2020 peak.  

Mike Hargrave
Mike Hargrave

Other Articles by Mike Hargrave:

    • Here Are the Most Active Metros for MOB Transactions
    • MOB Occupancy Rate Hovering at Cyclical High 
    • Is MOB Construction Beginning to Rise?

Previous Post:2021 Record Sales Activity Driven by Private Equity
Next Post:More Investors Shift Focus to Smaller Markets

Sidebar

Topics

  • Construction/Development
  • Industry News
  • Leasing/Property Management
  • Mergers/Acquisitions
  • Policy/Legislation
  • Real Estate Financing/Capital Markets
  • Revista Best Practices
  • Revista News
  • Sponsor Spotlight
  • Transactions
  • Uncategorized

Archives

RSS Recent Blog Posts

  • Which MOB Markets have the Most Concentrated Ownership? November 21, 2025
    To answer this, we analyzed how MOB square footage is spread across all the owners in each of the top 125 markets. The chart below lists the most concentrated markets, with . . . The post Which MOB Markets have the Most Concentrated Ownership? appeared first on RevistaMed.
    Stephen Lindsey
  • Here Are the Most Active Metros for MOB Transactions November 20, 2025
    RevistaMed tracks medical office (or medical outpatient) building transaction activity across the US and has a time series back to 2013. The post Here Are the Most Active Metros for MOB Transactions appeared first on RevistaMed.
    Mike Hargrave
  • Sales Activity Across Different Types of Healthcare Real Estate October 31, 2025
    Medical real estate seems to be in a tide shift when it comes to sales activity. With a second 25-bps cut in the federal funds rate and the announcement of the Remedy/Welltower transaction, we already know 4Q . . . The post Sales Activity Across Different Types of Healthcare Real Estate appeared first on RevistaMed.
    Stephen Lindsey
  • MOB Occupancy Rate Hovering at Cyclical High  October 30, 2025
    The Medical Outpatient Building or Medical Office Building sector (both MOB) is at a cyclical high in 3Q25. The post MOB Occupancy Rate Hovering at Cyclical High  appeared first on RevistaMed.
    Mike Hargrave

Other Free Resources

Industry Directory

Search for and/or list your medical real estate services in Revista’s medical real estate directory.

Reports & White Papers

Download free reports & white papers on medical real estate.

Add Lease/Sale Listing

Revista provides free lease/sale listings for healthcare real estate.

Ready to Schedule a Demo?

Get in Touch Now
  • Why Subscribe?
  • Events
  • The MOB Scene
  • Add A Directory Listing
  • Add Lease/Sale Listing
  • Contact Us
  • Sponsorship
  • About
  • Data Terms of Use
  • Sponsorship Terms
  • Press

SIGN UP FOR MOB SCENE NEWSLETTER

  • Twitter
  • Facebook
  • LinkedIn