• Skip to main content
  • Skip to header right navigation
  • Skip to site footer
  • Blog
  • Free Resources
RevistaMed

RevistaMed

  • About
    • Meet Revista
    • Advisory Board
    • Partners
    • Press
    • Rising Leaders Council
    • Sponsorship
    • Contact Us
  • Events
    • 2026 Revista Medical Real Estate Investment Forum
    • Subscriber Webinar
  • Why Subscribe?
    • Schedule a Demo
    • Revista x Pivotal
    • Featured Products
    • Business Development
    • Underwriting & Due Diligence
    • Asset Management
    • Capital Markets
    • Site Selection & Development
    • Leasing
  • Subscriber Login
Home / Leasing/Property Management / MOB Occupancy Trends Across the Country

MOB Occupancy Trends Across the Country

August 31, 2022 by Stephen Lindsey Topics: Leasing/Property Management, Real Estate Financing/Capital Markets

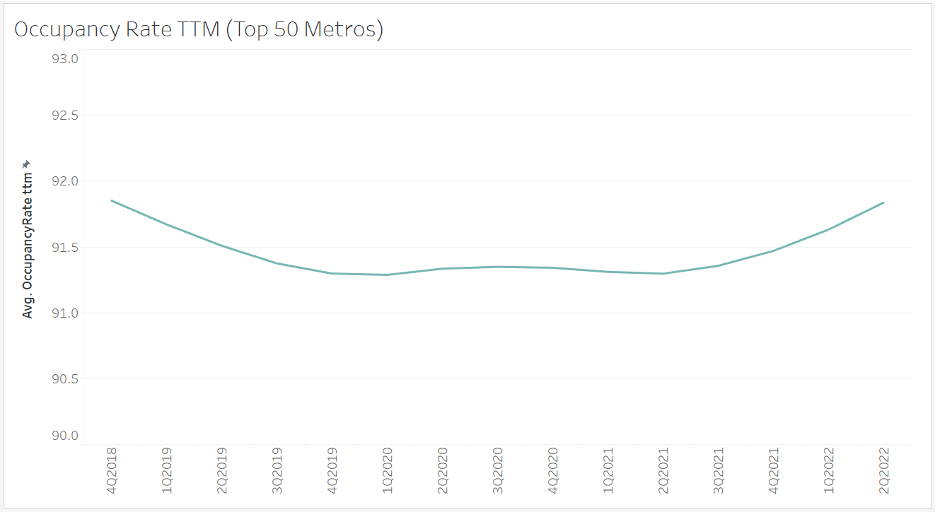
If we take a look at the overall occupancy trends for the top 50 metros, we can see that a shallow U-shape has formed over the past few years. While this pattern shows a modest dip followed by a recovery, this may not be the story for individual metros.

The map below covers the same time gap, going from the end of 2018 to the first half of the current year. It compares the change between the two endpoints from an occupancy and inventory perspective. The map shows that there are diverse changes across the different markets. The large, blue bubbles represent markets that have seen relatively large increases in inventory and occupancy. This is an impressive combination as demand for space must be quite strong for occupancy to increase when a lot of new space is being made available. 

We can also see some differences across geographical clusters. For example, apart from Florida, the Southeastern quadrant has a lot of orange, indicating falling occupancy rates. However, there are also a lot of large bubbles in this region, pointing to larger increases in inventory, which could explain some of the decreasing occupancy. 

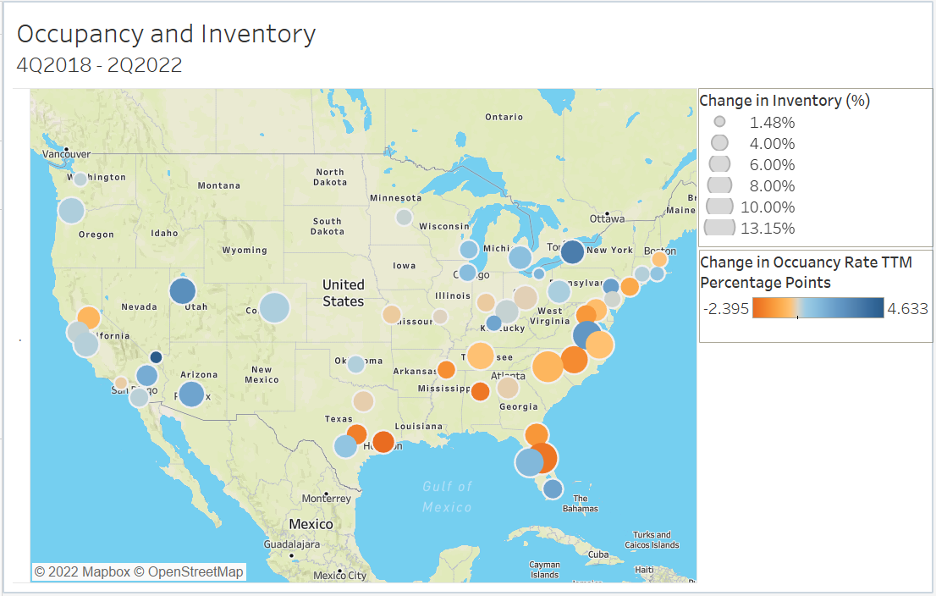
Each market is unique and will react differently to the everchanging economic conditions. This map only provides a snapshot of a complex market, so make sure to stay up to date as we continue to provide comprehensive coverage of the MOB sector. 

Stephen Lindsey

Other Articles by Stephen Lindsey:

    • Outpatient & Inpatient Employment Growth
    • Medical Space in the Most Populous Metros
    • MOB Construction Update

Previous Post:San Jose & Las Vegas Top Markets for MOB Rent Growth
Next Post:*NEW* Hospital Market Share Report

Sidebar

Topics

  • Construction/Development
  • Industry News
  • Leasing/Property Management
  • Mergers/Acquisitions
  • Policy/Legislation
  • Real Estate Financing/Capital Markets
  • Revista Best Practices
  • Revista News
  • Sponsor Spotlight
  • Transactions
  • Uncategorized

Archives

RSS Recent Blog Posts

  • Outpatient & Inpatient Employment Growth August 29, 2025
    Growth in the healthcare industry has continued to outpace the overall job market and we continue to hear in the BLS monthly job report that healthcare and social assistance is a leading contributor of job growth. The largest gains tend to be on the . . . The post Outpatient & Inpatient Employment Growth appeared […]
    Stephen Lindsey
  • Rehabilitation hospital construction showing signs of rising in 2025 July 29, 2025
    While outpatient construction has slowed down inpatient construction is holding steady to rising.  As you may know, Revista tracks inpatient general acute care hospitals, behavioral health hospitals, and inpatient rehabilitation hospitals (IRFs).  Within the IRF sector, Revista currently tracks over 500 rehabilitation hospitals in the US.  The sector has seen tremendous growth since 2014 growing […]
    Mike Hargrave
  • Hospital Performance Impacts Outpatient Occupancy & Rent July 29, 2025
    With the passing of the One Big Beautiful Bill, many hospitals across the country will be facing additional financial pressures in coming years. Millions of people are estimated to lose … The post Hospital Performance Impacts Outpatient Occupancy & Rent appeared first on RevistaMed.
    Hilda Martin
  • Medical Space in the Most Populous Metros June 30, 2025
    Nearly 70% of the medical office space in the US is located within the top 100 metro areas. The New York metro area alone makes up close to 5% of the national total. Urban areas contain the bulk of the population and medical space, but . . . The post Medical Space in the Most […]
    Stephen Lindsey

Other Free Resources

Industry Directory

Search for and/or list your medical real estate services in Revista’s medical real estate directory.

Reports & White Papers

Download free reports & white papers on medical real estate.

Add Lease/Sale Listing

Revista provides free lease/sale listings for healthcare real estate.

Ready to Schedule a Demo?

Get in Touch Now
  • Why Subscribe?
  • Events
  • The MOB Scene
  • Add A Directory Listing
  • Add Lease/Sale Listing
  • Contact Us
  • Sponsorship
  • About
  • Data Terms of Use
  • Sponsorship Terms
  • Press

SIGN UP FOR MOB SCENE NEWSLETTER

  • Twitter
  • Facebook
  • LinkedIn